
2017: a year in weather statistics
Author: Press Office
10:56 (UTC) on Fri 29 Dec 2017
Provisional statistics suggest 2017 will be the fifth warmest year for the UK since 1910.
Currently for average temperature 2017 will be warmer than both 2015 and 2016, but it is anticipated it will be cooler than 2014, 2006, 2011, and 2007. All the nine warmest years since 1910, have occurred since 2000.
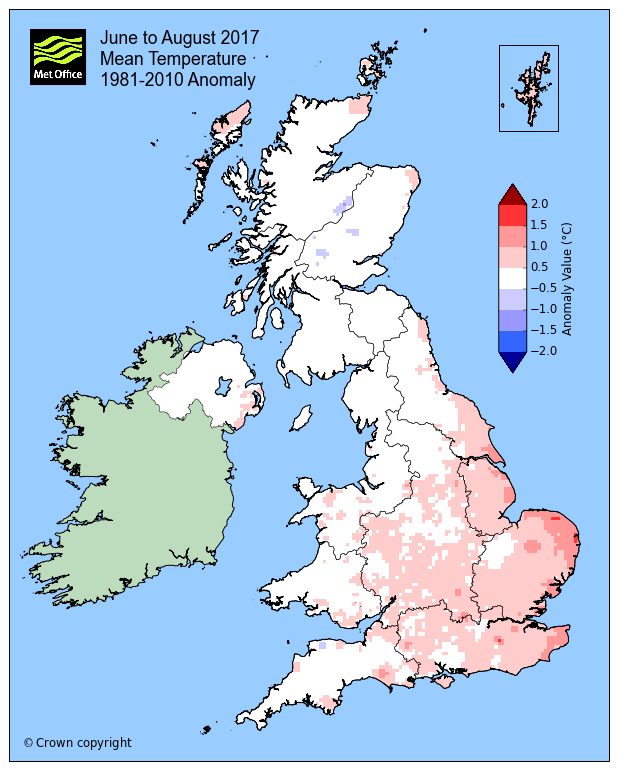
The warmest year in the UK since 1910 was in 2014 when the mean temperature was 9.91 °C (1.06 °C above the 1981–2010 long-term average). Provisional figures for 2017 suggest the mean UK temperature will be 9.56 °C (0.72 °C above the 1981–2010 average).
The mean temperature for England was 10.42 °C (0.77 °C above the long-term average), making it nominally the fourth warmest year since 1910. The mean temperature for Wales of 9.91 °C was also 0.77 °C above the long-term average.
Dr Mark McCarthy, manager of the Met Office’s National Climate Information Centre, said: “Although the year is likely to be the fifth warmest in the UK since 1910, many people will probably remember the year for some of its more notable weather events. Events like ex-hurricane Ophelia, which in October brought high winds and disruption to parts of Ireland and the UK, and memorably for some drew up dust from the Sahara and smoke from the wildfires in Iberia, giving us the appearance of sunset at midday.”
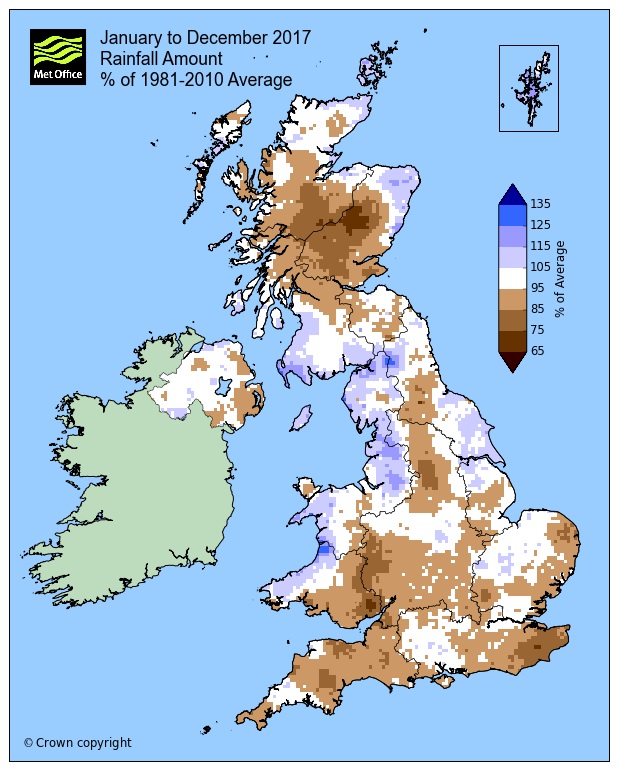
When considered as a whole, 2017 has been a rather average year for rainfall. Across the UK there was an average of 1,106.8mm of rain, which is 95.9% of rainfall when compared to the long-term average, 1981–2010). All of the UK countries received below average rainfall, with Scotland being the driest relative to average. Here only 94.9% of rainfall fell when compared with the long-term average. Wales, with 98.6% of long-term average rainfall, was the wettest relative to average.
|
|
2017 actual average max temp °C |
2017 average max temp anomaly °C |
2017 actual average min temp °C |
2017 average min temp anomaly °C |
2017 actual average mean temp °C |
2017 average mean temp anomaly °C |
2017 actual rainfall (mm) |
2017 rainfall anomaly % |
2017 actual sunshine hours |
2017 sunshine hours anomaly % |
|---|---|---|---|---|---|---|---|---|---|---|
|
UK |
13.1 |
0.7 |
6.1 |
0.8 |
9.6 |
0.7 |
1106.8 |
96 |
1395.4 |
102 |
|
England |
14.2 |
0.7 |
6.7 |
0.8 |
10.4 |
0.8 |
820.2 |
96 |
1527.3 |
102 |
|
Wales |
13.2 |
0.6 |
6.6 |
0.9 |
9.9 |
0.8 |
1438.7 |
99 |
1339.7 |
96 |
|
Scotland |
11.3 |
0.7 |
4.8 |
0.7 |
8.1 |
0.7 |
1490.1 |
95 |
1219.3 |
103 |
|
Northern Ireland |
13.0 |
0.5 |
6.0 |
0.6 |
9.5 |
0.6 |
1117.7 |
98 |
1236.7 |
99 |
Anomaly figures are relative to the 1981–2010 long-term average.
December 2017
Although much of the early part of December was cold with significant snowfall in some areas and numerous frosts in most areas, the mean UK temperature for the month is likely to be 0.4 °C above the 1981–2010 long-term average.
With significant snowfall occurring in parts of the UK, it might seem surprising that the UK has only received just over three-quarters (78%) of the long-term rainfall expected for December (up to and including the 27th).
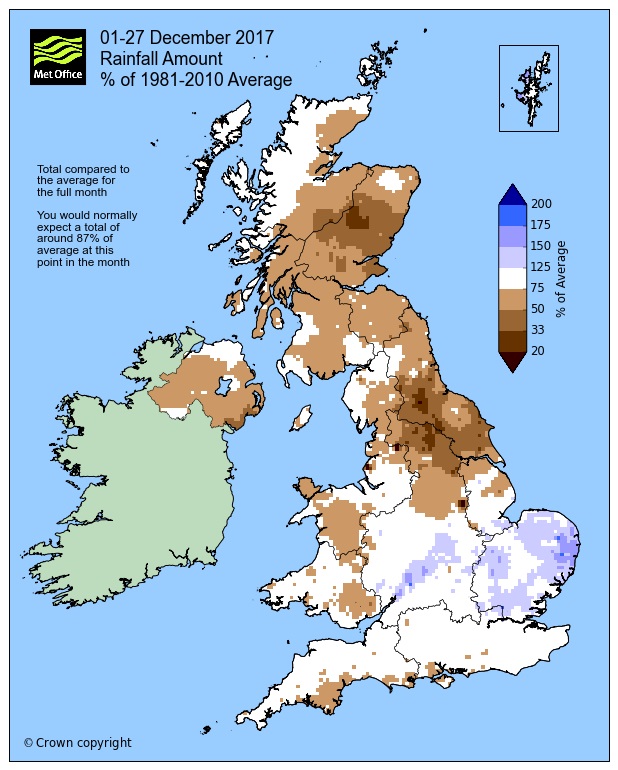
Tim Legg, of the Met Office’s National Climate Information Centre, added: “Many places have had a rather dry month, especially eastern areas from Lincolnshire to Aberdeenshire. Much of the rainfall has fallen during mid-month and the final week.”
|
|
Dec 2017 actual average max temp °C |
Dec 2017 average max temp anomaly °C |
Dec 2017 actual average min temp °C |
Dec 2017 average min temp anomaly °C |
Dec 2017 actual average mean temp °C |
Dec 2017 average mean temp anomaly °C |
Dec 2017 actual rainfall (mm) |
Dec 2017 rainfall anomaly % |
Dec 2017 actual sunshine hours |
Dec 2017 sunshine hours anomaly % |
|---|---|---|---|---|---|---|---|---|---|---|
|
UK |
6.9 |
0.3 |
1.5 |
0.4 |
4.2 |
0.4 |
93.2 |
78 |
39.8 |
98 |
|
England |
7.4 |
0.2 |
1.8 |
0.2 |
4.6 |
0.3 |
74.6 |
85 |
48.8 |
103 |
|
Wales |
7.4 |
0.2 |
2.4 |
0.6 |
5.0 |
0.5 |
126.8 |
76 |
30.5 |
72 |
|
Scotland |
6.0 |
0.5 |
0.5 |
0.4 |
3.3 |
0.5 |
117.4 |
72 |
29.6 |
98 |
|
N Ireland |
7.5 |
0.1 |
2.4 |
0.8 |
5.0 |
0.5 |
79.7 |
70 |
28.8 |
78 |
Anomaly figures are relative to the 1981–2010 long-term average.