Increasing influence of climate change on UK climate
Author: Grahame Madge
06:36 (UTC+1) on Fri 31 Jul 2020
The sixth report in the State of the UK Climate series confirms that 2019 was the 12th warmest year in a series from 1884.
The latest report covering the climate of the UK – published today [Friday 31 July ]- reveals that the most recent decade (2010-2019) has been on average 0.9° C warmer across the UK than the period 1961-1990, with 2019 being 1.1° C above the 1961-1990 long-term average.
2019 sets four UK high temperature records
Although sitting outside the top ten warmest years in the series (all since 2002), 2019 was most remarkable for setting four UK high temperature records, including:
- A new all-time record (38.7° C) 25 July, Cambridge University Botanic Gardens (Cambridgeshire)
- A new winter record (21.2° C) 26 February, Kew Gardens (London); the first time 20 C has been reached in the UK in a winter month.
- A new December record (18.7° C) 28 December, Achfary (Sutherland).
- A new February minimum record (13.9° C) 23 February, Achnagart (Highland)
The all-time and winter records also created new high-temperature records for February and July.
No national low-temperature records were set during the year.
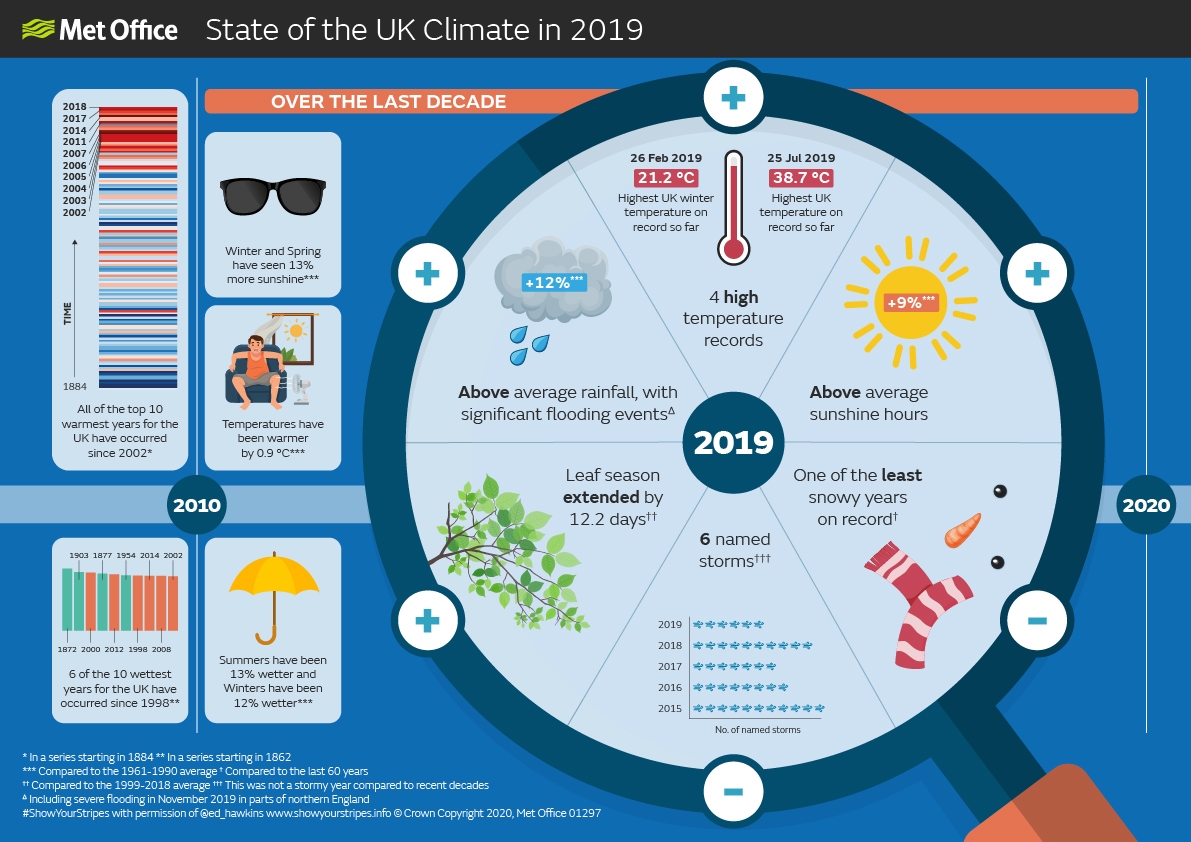
State of the UK Climate in 2019
- All of the top 10 warmest years for the UK have occurred since 20021
- 6 of the 10 wettest years for the UK have occurred since 19982
Climate statistics over the last decade
- Winter and Spring have seen 13% more sunshine3
- Temperatures have been warmer by 0.9 °C3
- Summers have been 13% wetter and winters have been 12% wetter3
Climate statistics in 2019
- 4 high temperature records
- Above average susnhine hours3
- One of the least snowy years on record4
- 6 named storms5
- Leaf season extended by 12.2 days6
- Above average rainfall, with significant flooding events7
The State of the UK Climate report is compiled by the Met Office and published in Royal Meteorological Society’s International Journal of Climatology.
Climate change exerts an increasing impact on the UK climate
Mike Kendon is the lead author of the report for the Met Office. He said: “Our report shows climate change is exerting an increasing impact on the UK’s climate. This year was warmer than any other year in the UK between 1884 and 1990, and since 2002 we have seen the warmest ten years in the series. By contrast, to find a year in the coldest ten we have to go back to 1963; over 50 years ago.”
The Central England Temperature series is the longest instrumental record of temperature in the world, with annual, seasonal and average monthly temperature information stretching back to 1659.
Mike Kendon added: “The Central England Temperature series shows us that the 21st Century so far has been warmer than the previous three centuries.”
The Central England mean temperature for the period 2001-2019 has been 10.3° C. The remaining averages in the series are: 1901-2000 (9.5° C); 1801-1900 (9.1° C); 1701-1800 (9.2° C); 1659-1700 (8.7° C).
Supporting the warming trend, the most recent decade (2010–2019) has had 6% fewer days of air frost and 10% fewer days of ground frost in the UK compared to the 1981–2010 average, and both 16% fewer compared to 1961–1990.
2019 was the sixth consecutive year with fewer frosts than average and it was one of the least snowy years on record.
Undeniable warming trend for the UK
Dr Mark McCarthy, head of the Met Office’s National Climate Information Centre, added: “The climate statistics over time reveal an undeniable warming trend for the UK. We are also reporting on changes in other aspects of our weather and environment such as rainfall, snow, sunshine, sea level and even tree leafing dates. The observed changes are to varying degrees a consequence of both global climate change and natural variability in our climate. A comprehensive report such as the State of Climate provides the basis for ongoing research to better document and understand the climatic changes that we can expect in future.”
The UK rainfall total for 2019 was 1,227 mm, 107% of the 1981–2010 average, and 112% of the 1961-1990 average. Most of the UK received above average rainfall, with the exception of parts of East Anglia and the Home Counties, western and northern Scotland and Shetland.
Dr Mark McCarthy added: “It was a particularly wet year across parts of central and northern England—notably Lincolnshire, Nottinghamshire, Derbyshire, Leicestershire and Cheshire received between a quarter to one third more rainfall than normal. For northern England (north of a line from the Wash to North Wales) this was the ninth wettest year in a series from 1862.
“Parts of northern England, particularly South Yorkshire and Derbyshire, experienced some very severe flooding in early November. It’s worth noting that since 2009 the UK has now had its wettest February, April, June, November and December on record – five out of 12 months.”
An important record of weather and climate in the UK
The State of the UK Climate Reports are published annually in the Royal Meteorological Society’s International Journal of Climatology. The reports are open access, and they are freely available for anyone to read and provide an opportunity for other scientific papers to reference the report.
Professor Liz Bentley, Chief Executive of the Royal Meteorological Society, said: “The reports provide an important record of the weather and climate in the UK each year, highlighting short‐term variations as well as long‐term trends of what has actually happened and how our climate is changing. We are delighted that this year there is a section on phenology - the study of plants and animals in response to the weather and climate.”
The National Oceanography Centre (NOC) contributed to the sea-level section of this report. The NOC’s Director, Professor Edward Hill, said: “Sea-level around the UK is expected to continue to rise due to an increased rate of ice loss from the Greenland and Antarctic ice-sheets, as well as continued glacier mass loss and warming of the ocean. An immediate consequence will be higher extreme sea-levels, which cause flooding and threaten lives, property and key infrastructure.
“However, the report highlights continuing concerns around the quality of UK sea-level measurements. As the report states, we have been unable to calculate the uncertainty of the UK sea-level index for 2018 and 2019, as only one of the long-term tide gauge sites is producing data of sufficient quality.
“High-frequency, high-accuracy, coastal sea-level monitoring is essential.”
Changes in phenology (recurring events in nature and their relationships with climate) provide a wide range of information about the health and functioning of plants and ecosystems, and their responses to climate. The Woodland Trust contributed to the State of the UK Climate report through its phenology project: Nature’s Calendar.
Darren Moorcroft, chief executive of the Woodland Trust, said: “Understanding the impacts of climate change is crucial in helping us fight it.”
“In response to the warm winter and mild spring temperatures, the first leaves appeared on trees nearly ten days earlier in 2019, compared to our baseline period. Whilst this may not sound like much, research using these citizen science records has shown this can have dire impacts further down the food chain.
“Our trees, and all the wildlife they support, are on the frontline of climate change and ultimately some species will be able to adapt better than others.
“This is a stark reminder of the need to take immediate action on climate change. Trees are not only a measure of what’s happening, they’re a vital part of the solution: As natural carbon stores they’re key agents in fighting climate change and mitigating against its impacts, for example in their role in lessening the devastating effects of flooding.”
Sources and notes
1In a series starting in 1884
2In a series starting in 1862
3Compared to the 1961-1990 average
4Compared to the last 60 years
5This was not a stormy year compared to recent decades
6Compared to the 1999-2018 average
7Including severe flooding in November 2019 in parts of northern England