
March statistics may challenge your perception
Author: Press Office
13:12 (UTC+1) on Thu 29 Mar 2018
After two significant and impactful periods of snow, you might expect March 2018 to be the coldest on record.
However, early indications are that this will not be the case. Mean temperatures for the month so far (to 28th) have been well below average in all areas, typically by nearly 2 °C. However, this is around 1½ °C less cold than the notable March of 2013, which was the coldest March since 1962. Perhaps surprisingly, March 2018 will not rank within the coldest ten Marches since 1910. However, it could end up being the third coldest March in the last 30 years.
The month began with unseasonably cold air of Siberian origin covering the UK, and this became known in the media as “the Beast from the East”. This led to the first episode of notable weather on the 1st and 2nd with significant falls of powdery snow, compounded by freezing rain. These two days were both bitterly cold, with a strong easterly wind, and temperatures across many parts of the UK failed to rise above freezing. The daily maximum temperature on 1st March 2018 at Tredegar (Blaenau Gwent) was only -4.7 °C; the lowest March daily maximum temperature on record for the UK, and the ‘feels like’ temperature was widely around -10 °C.
Conditions on the Scottish mountain summits were unusually severe with an air temperature on Cairngorm summit of -10 to -14 °C combined with wind speed of over 46mph resulting in a ‘feels like’ temperature approaching -30 °C – around the lowest for at least 25 years. After that, temperatures gradually returned nearer to normal for a time and many of us had a good deal of sunshine. However, temperatures fell again in the middle of the month, leading to the second significant bout of snow on the 18th/19th. Some areas finally began to feel more spring-like around 22nd-26th, though the last few days of the month look like being colder than average with a return of easterly winds.
Although the average and minimum temperatures were not exceptional, maximum temperatures in the first couple of days of the month were very unusual, with negative figures being recorded widely. In practice, what this meant was that air temperatures in large parts of the country stayed below zero for more than 48 hours. Problems with burst water pipes may have been caused by the unusual longevity of the freezing temperatures. The map below shows how much below normal maximum temperatures were than normal in different parts of the country.
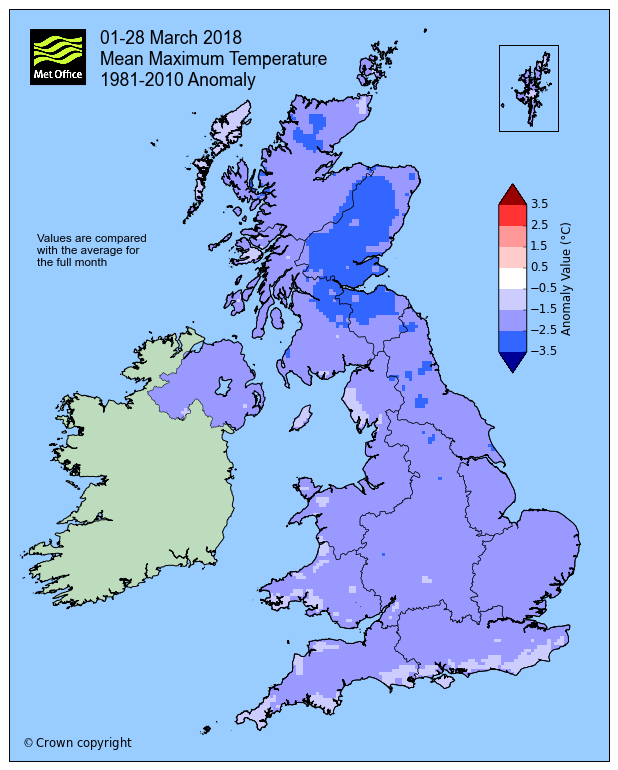
Fig 1. Provisional map showing the average maximum temperature 1 - 28 March 2018, compared with the 1981-2010 long-term average.
Rainfall for the UK as a whole during the month so far has been around normal, though the rain has been distributed around the country in an unusual way, partly due to the predominately easterly winds. It has been notably dry in north-west Scotland, whereas a swathe from Cornwall all the way up to Aberdeenshire has been rather wet, with some places more than doubling their March average. Of course, a significant proportion of this precipitation fell as snow.
The map below compares monthly rainfall totals with typical March values. The brown colours show areas with much less rain than usual, whereas the blue areas show the parts of the country which were particularly wet. Further information about the severe weather during March is available on our website.
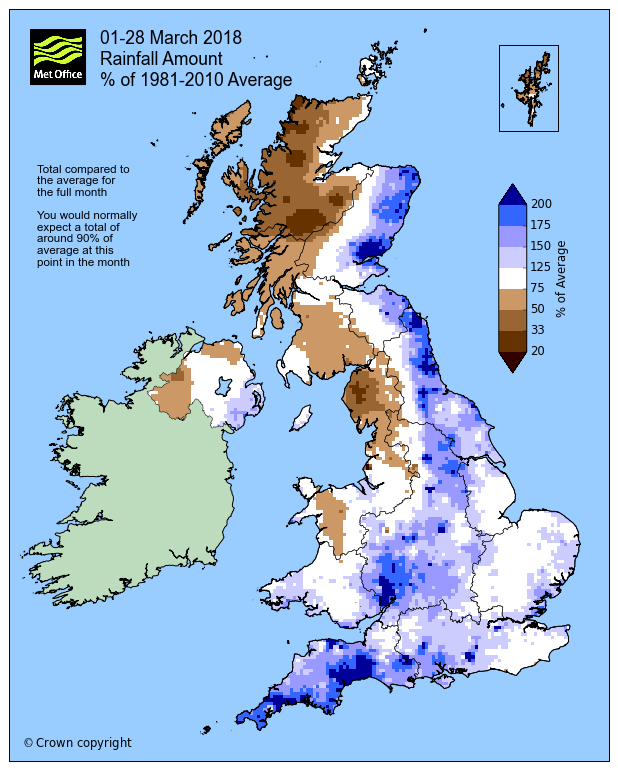
Fig 2. Provisional map showing the percentage of rainfall from 1 - 28 March 2018, compared with the 1981-2010 long-term average.
Complete March weather statistics will be published early in April.
| Maximum temperature | Minimum temperature | Mean temperature | Sunshine duration | Precipitation | ||||||
|---|---|---|---|---|---|---|---|---|---|---|
| Act °C | Anom | Act °C | Anom | Act °C | Anom | Act hours | Anom % | Act mm | Anom % | |
| UK | 6.9 | -1.9 | 0.8 | -1.3 | 3.8 | -1.6 | 85 | 83 | 104.4 | 110 |
| England | 7.9 | -1.9 | 1.4 | -1.2 | 4.7 | -1.5 | 80.4 | 75 | 102.2 | 160 |
| Wales | 7.2 | -1.8 | 1 | -1.6 | 4.1 | -1.7 | 86.4 | 85 | 151.4 | 130 |
| Scotland | 5.2 | -2 | -0.4 | -1.4 | 2.4 | -1.7 | 90.8 | 98 | 98.7 | 70 |
| N Ireland | 7.3 | -2 | 0.6 | -1.9 | 3.9 | -1.9 | 90.4 | 92 | 85.8 | 90 |