Briefing on Arctic and Antarctic sea ice - August 2018
sea ice briefing document
Current Arctic sea ice extent
Arctic sea ice extent on 12th August 2018 was 5.84 million square km according to data from the US National Snow and Ice Data Center (NSIDC). This is the seventh lowest value for this date on record, 1.52 million square km below the 1981-2010 average, and 0.91 million square km above the record low for this date, which occurred in 2012 (Figure 1).
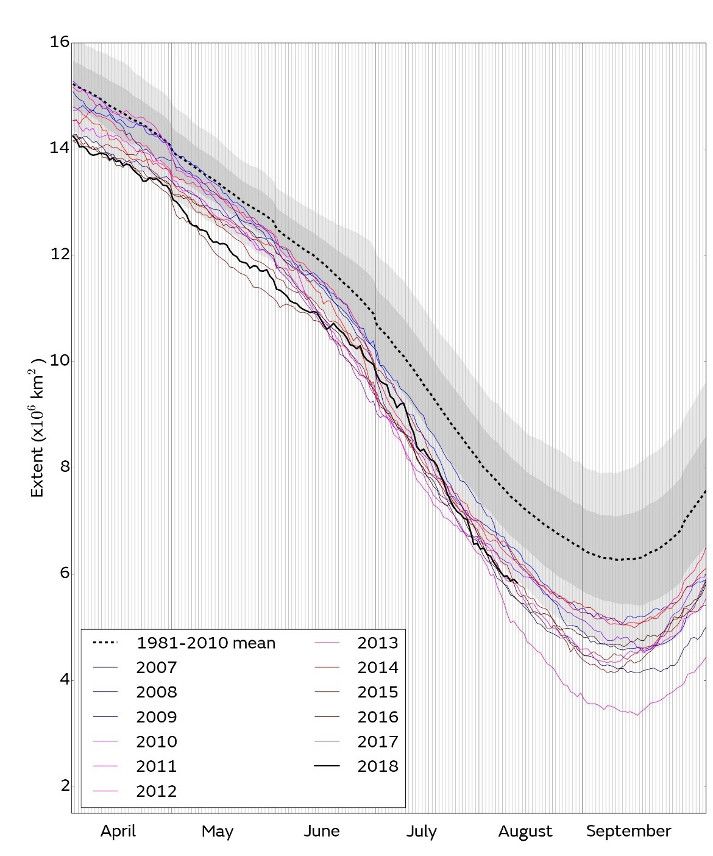
Figure 1. Daily Arctic sea ice extent for 2018, compared with recent years and the 1981-2010 average with ± 1 and 2 standard deviation intervals indicated by the shaded areas. Data are from the National Snow and Ice Data Center (NSIDC).
Extent was well below average in all areas of the Arctic except the Central Arctic and the East Siberian Sea. In the latter region, ice concentration was very low, rendering the ice vulnerable to further melting during August, although some of the open water shown by the satellite sensors may represent meltponds on the ice. The Laptev, Kara and Barents Seas have maintained below average extents since the start of the melt season, and extent in the Kara Sea in particular is exceptionally low following very fast melting during July. In the Beaufort Sea, substantial ice-free areas have opened up during July, despite very slow melting observed during June. A region of sea ice in the southern Beaufort Sea has become detached from the main pack, and is likely to melt out completely by September.
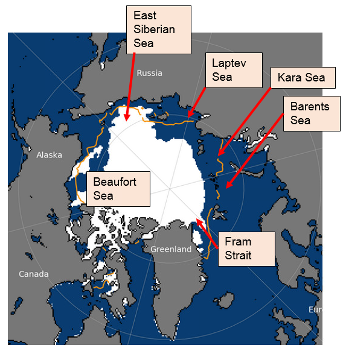
Figure 2. Arctic sea ice extent on 12th August 2018, with 1981-2010 average extent indicated in orange, and the regions referred to in the text labelled. Underlying map and data courtesy of NSIDC.
July 2018 in context
Average sea ice extent for the month of July 2018 was 8.21 million square km according to the HadISST1.2 dataset (Rayner et al., 2003). This is the ninth lowest July extent on record (the lowest was 7.56 in 2011), 1.26 million square km below the 1981-2010 average, and 0.39 million square km above the long-term linear trend (Figure 3).
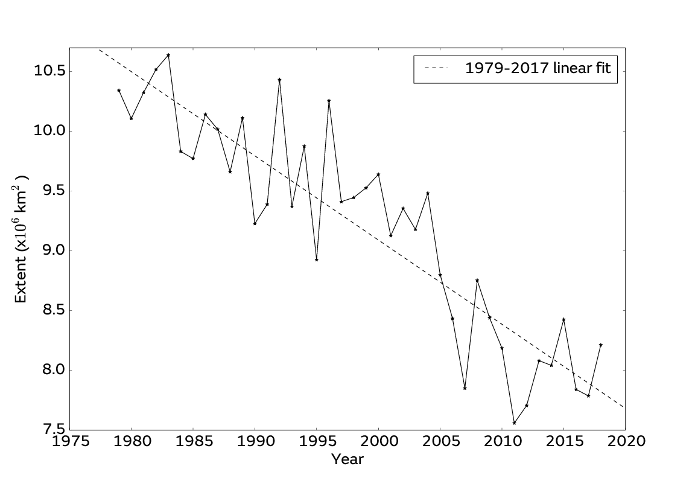
Figure 3. Average July Arctic sea ice extent according to the Hadley Centre Sea Ice and Sea Surface Temperature (HadISST) 1.2 dataset (Rayner et al, 2003).
The average rate of sea ice loss during July was 107,000 square km per day according to data from NSIDC, well above the 1981-2010 average of 86,000 square km per day, and the highest rate observed in the satellite era. The rate of loss was highly variable, being close to average during the first half of the month but exceptionally fast during the second half.
Due to the very fast rate of ice loss seen during July, by month-end extent was similar to the lowest values observed for the date on record, seen in 2012. However, during the first week of August melting has substantially slowed.
July was dominated by cyclonic conditions (Figure 4a), with a relentless succession of storms tending to form over the Arctic Ocean coastal seas. Southerly winds have been particularly frequent in the Fram Strait, Barents Sea and western Kara Sea regions, with significant warm temperature anomalies observed here (Figure 4b). The Beaufort Sea remained unusually cold during the first half of July, with frequent northerly and easterly winds driving sea ice towards the Alaskan coast, but became milder during the second half of the month. The Laptev Sea and eastern Kara Sea experienced cold conditions throughout the month, and the rapid ice loss observed in these regions is somewhat surprising. It may reflect unusually thin ice at the start of the month, and/or enhanced ocean melting of ice due to the very windy, stormy conditions.
 |
 |
Figure 4. (a) Mean sea level pressure anomaly; (b) air temperature anomaly at 925mb for July 2018, relative to the 1981-2010 average. Data are from the NCEP reanalysis.
Outlook for September
A number of predictions of this year’s seasonal Arctic minimum (September) ice extent are displayed in Figure 5, and described below:
- The Sea Ice Prediction Network (SIPN) July Outlook report includes 39 predictions of mean September ice extent based on a variety of methods and from centres around the world. Except for one outlier, the predictions range from 3.91 to 5.2 million square km, with a median of 4.7 million square km and an interquartile range of 4.4 to 4.9 million square km. Only the lowest prediction, 3.4 million square km (the outlier), would indicate a record low September extent.
-
Statistical predictions based on an extrapolation of the linear trend for the entire satellite period from 1979-2017 (black), and most recent 15 years (red) suggest a mean September sea ice extent of 4.42 (±1.09) and 4.18 (± 1.11) million square km respectively.
-
There is a good correlation between mean September ice extent and the extent for 29th July – 12th August (the most recent 15 days of data available at the time of writing). Applying simple statistical methods to the anomalies for these dates gives a prediction of September mean extent of 4.50 (± 0.52) million square km, indicated in blue on Figure 5.
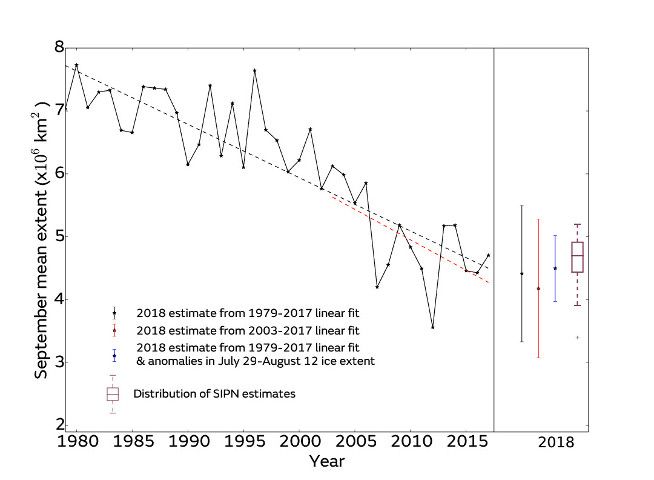
Figure 5:September median Arctic sea ice extent since satellite records began in 1979 from the HadISST1.2 dataset (Rayner et al., 2003), with predictions from the SIPN Sea Ice Outlook and statistical predictions for September 2018. For the statistical predictions, error bars represent twice the standard deviation of September mean ice extent about the trend lines with respect to which the estimates are taken. The Sea Ice Outlook is shown as a boxplot indicating range, median and quartiles of the 33 predictions submitted.
Although these predictions suggest that a new record low September extent is very unlikely this year, there remains some uncertainty, particularly following the extreme volatility of the rate of ice loss observed so far this melt season.
Antarctic sea ice state
Antarctic sea ice extent on 12th August was 17.03 million square km (Figure 6). This is the fifth lowest value for this date on record, 0.57 million square km below the 1981-2010 average, and 0.26 million square km above the lowest value for this date, which occurred in 1986. Extent remained particularly low relative to average in the Weddell Sea, and was also below average in parts of the Indian Ocean sector; however, extent was substantially above average in the Bellingshausen Sea (Figure 7).
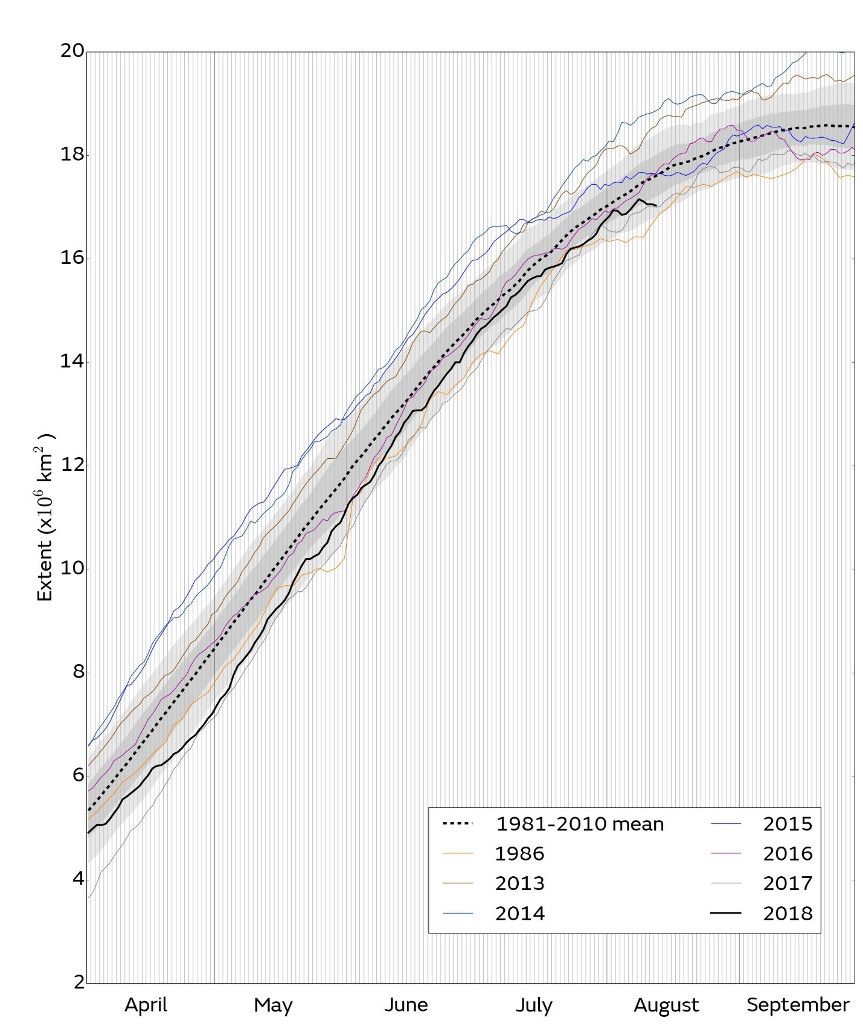
Figure 6. Daily Antarctic sea ice extent for 2018, compared with recent years, the low-ice year of 1986, and the 1981-2010 average, with ± 1 and 2 standard deviation intervals indicated by the shaded areas. Data are from NSIDC.
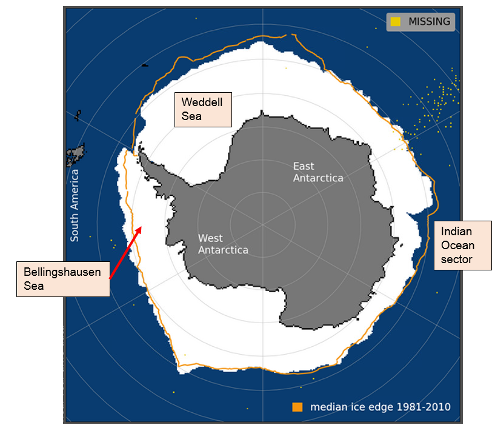
Figure 7. Antarctic sea ice extent on 12th August 2018, with 1981-2010 average extent indicated in orange, and regions referred to in the text labelled. Underlying map and data courtesy of NSIDC.
References
Rayner, N. A.; Parker, D. E.; Horton, E. B.; Folland, C. K.; Alexander, L. V.; Rowell, D. P.; Kent, E. C. and Kaplan, A.: Global analyses of sea surface temperature, sea ice, and night marine air temperature since the late nineteenth century. J. Geophys. Res. Vol. 108, No. D14, 4407 10.1029/2002JD002670, 2003.
13th August 2018
Alex West, Chris Wyburn-Powell and Ed Blockley