Arctic sea ice update - October 2018
Briefing on the 2018 Arctic sea ice melt season and the Antarctic sea ice state by Alex West and Ed Blockley
Summary
- Sea ice extent for September 2018 was 4.70 million square km, the joint-7th lowest in the satellite era (with September 2017). Extent was particularly low this year in the Laptev, Kara, Chukchi and western Beaufort seas.
- Weather conditions in the Arctic this summer were quite unsettled, and often relatively warm. Although ice loss was quite slow early and late in the season, ice loss was very fast during the second half of July, possibly in association with southerly winds and storms in the Siberian coastal seas.
- Predictions of September ice extent this year as submitted to the Sea Ice Prediction Network (SIPN) were in the main relatively accurate, as is common in years where September ice extent has fallen close to the long-term linear trend.
- In the Antarctic, sea ice extent remains low for the time of year; the maximum sea ice extent for the year of 18.15 million square km, recorded on 30th September, is currently the fourth lowest on record. It is not yet certain that extent will not rise further.
September sea ice extent
Arctic sea ice extent for the month of September 2018 was 4.70 million square km according to the HadISST1.2 dataset (Rayner et al, 2003). This was the joint-7th lowest September extent in the satellite era – almost exactly equal to that of last year. It is 1.69 million square km below the 1981-2010 average, but quite close to the long-term linear trend for the fourth year in succession (Figure 1). Extent was particularly low in the Laptev, Kara, Chukchi and western Beaufort seas (Figure 2).
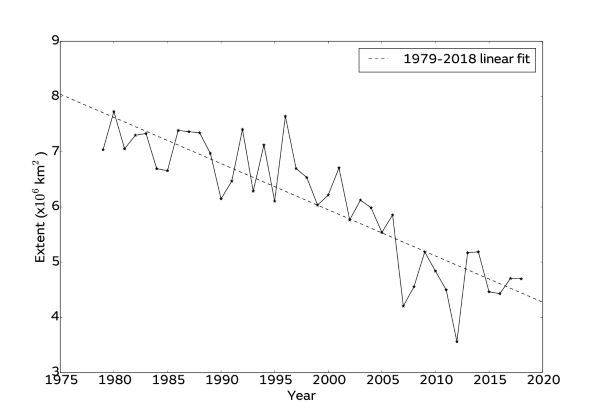
Figure 1. September sea ice extent during the satellite era, according to HadISST1.2, with linear trend indicated.
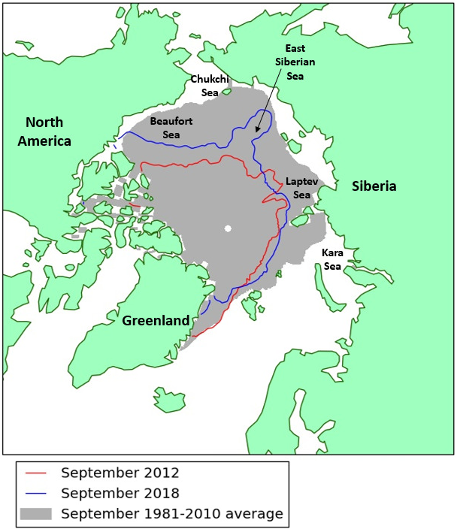
Figure 2. Arctic sea ice extent, September 2018, compared to the record low year of 2012 and the 1981-2010 average, with regions named in the text labelled. Data are from HadISST1.2.
Melt season review
The melt season of 2018 was notable for the high levels in variation of the melt rate of the Arctic sea ice. Exceptionally high rates of loss were observed during the second half of July, but quite low rates were seen during the rest of the season. The reasons behind this are likely to be complex.
The weather for the season overall in the Arctic tended to be quite stormy, particularly over Greenland and the American side of the Arctic (Figure 3a). There is a known association between stormy weather in the Arctic early in the summer and lower levels of sea ice loss for the season (Screen et al, 2011), but it is not definitively known whether stormy weather later in the season has such an effect; in fact a particularly powerful storm in 2012 was found to have slightly increased ice melting (Zhang et al, 2013). Because pressure tended to be higher over the Siberian coastal seas, in particular the East Siberian Sea, the adjacent Laptev and Kara Seas saw persistent southerly winds throughout the summer, and correspondingly ice melted back here very early. Air temperatures tended to be higher than average over much of the Arctic (Figure 3b), the main exception being the eastern Beaufort Sea, one of the few areas where sea ice extent in September was not substantially below average.
 |
 |
Figure 3. Anomaly in (left) mean sea level pressure; (right) air temperature at 925mb for May-August 2018 relative to the 1981-2010 average. Data are from the NCEP reanalysis.
The preceding winter of 2017-18 was the third in succession to be extremely mild in the Arctic; analysis by Stroeve et al (2018) has shown that the recent mild winters in the Arctic are likely to be somewhat reducing sea ice growth. Measurements by the CryoSat-2 radar sensor had shown large regions of ice to be below 2m in thickness during May, particularly in the western Beaufort, Chukchi and East Siberian sectors (Figure 4), all regions which saw substantial retreat of the sea ice edge during the summer. It was shown by Keen et al (2013) that sea ice thinner than 2m in May is very likely to melt out completely by September.
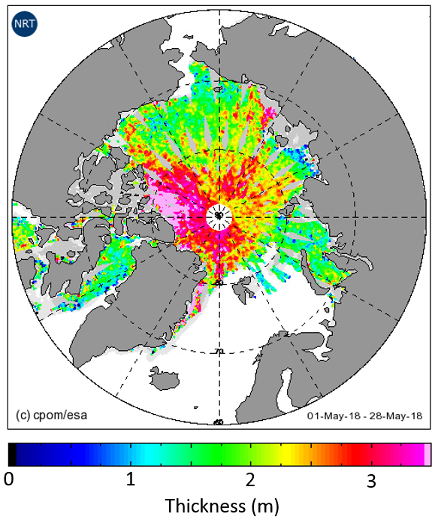
Figure 4. Average ice thickness from 1st – 28th May 2018, as estimated by the radar sensor aboard CryoSat-2. Image credit Centre for Polar Observation and Modelling (CPOM).
The ice that melted during the second half of July tended to be found in two regions: the region of thin ice identified above, and the Laptev and Kara seas, which as noted above tended to experience frequent southerly winds during the summer. In fact, July was, in the Siberian seas, by far the stormiest month of the summer. It is possible that here the abrupt acceleration of the melt rate observed reflected the ice thinning to a critical point where it was more vulnerable to ocean melting enhanced by storm activity.
Assessment of predictions
During the summer, the Sea Ice Prediction Network (SIPN) collates predictions of September Arctic sea ice extent from scientific centres around the world, and publishes these predictions in a series of outlooks, in June, July and August. In 2018 the observed September extent fell inside the central ranges of the distribution of predictions in all three reports, and in all three cases the median prediction was within 0.2 million square km of the eventual extent. This is consistent with a finding by Stroeve et al (2014) that the SIPN predictions tend to be more skilful in years in which sea ice extent was close to the linear trend.
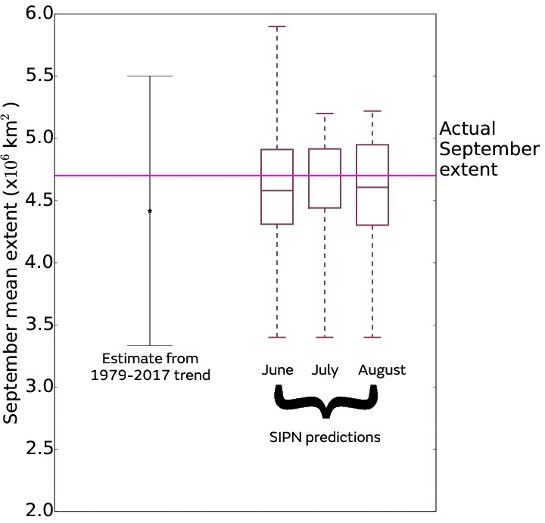
Figure 5. Arctic sea ice extent for September 2018 according to HadISST1.2 (pink line), compared to an extrapolation from the long-term linear trend and predictions submitted to the three SIPN reports (maximum, minimum, median and quartiles from each distribution shown).
Antarctic sea ice extent
Antarctic sea ice usually reaches its maximum extent at some point during September, although as the maximum extent to date was recorded as recently as 30th September, it is not yet certain that extent will not rise further. The maximum extent to date, 18.15 million square km, would represent the fourth lowest annual maximum Antarctic sea ice extent in the satellite record (the lowest having been 17.89 million square km in 1986), and would be 0.55 million square km below the 1981-2010 average.
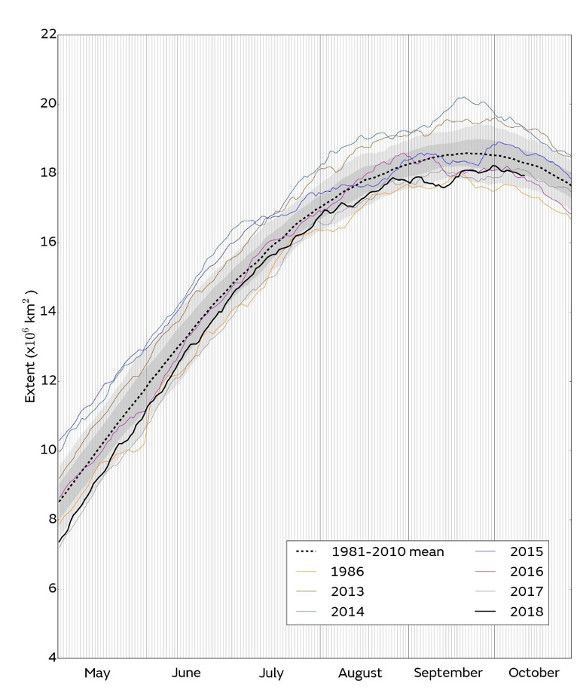
Figure 6. Antarctic sea ice extent for 2018 and other recent years, plus the record low year of 1986, compared to the 1981-2010 average, with 1 and 2 standard deviation intervals indicated. Data are from NSIDC.
Antarctic sea ice extent has mostly been at low or very low levels since autumn 2016, although the anomaly varies between regions. In September 2018, while large areas of the ice edge were further south than average, particularly in the Weddell Sea, the ice edge was actually further north than average in the Bellingshausen Sea (Figure 7), a pattern that has been observed frequently in recent years.
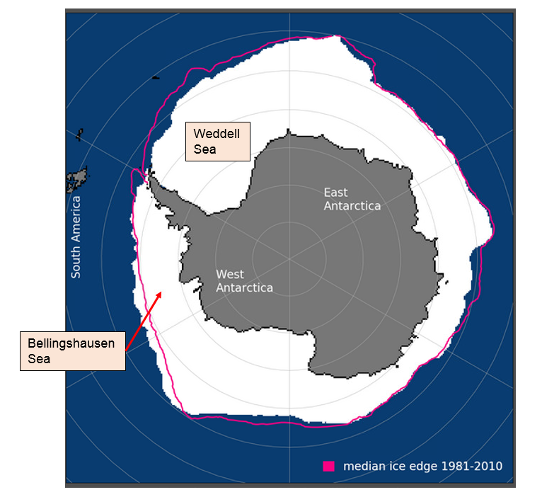
Figure 7. Average Antarctic sea ice coverage during September 2018, with average September sea ice extent from 1981-2010 indicated in pink. Data are from NSIDC.
References
Keen, A. B., Hewitt, H. T., Ridley, J. K. (2013) A case study of a modelled episode of low Arctic sea ice. Climate Dynamics, Volume 41, Issue 5, pp 1229–1244. doi: 10.1007/s00382-013-1679-y
Rayner, N. A.; Parker, D. E.; Horton, E. B.; Folland, C. K.; Alexander, L. V.; Rowell, D. P.; Kent, E. C.; Kaplan, A. (2003) Global analyses of sea surface temperature, sea ice, and night marine air temperature since the late nineteenth century J. Geophys. Res. Vol. 108, No. D14, 4407 10.1029/2002JD002670
Screen, J. A., Simmonds, I., Keay, K. (2011) Dramatic interannual changes of perennial Arctic sea ice linked to abnormal summer storm activity, J. Geophys. Res. (Atmos), 116, D15105, doi:10.1029/2011JD015847
Stroeve, J. C.; Hamilton, L. C.; Bitz, C. M.; Blanchard-Wrigglesworth E. (2014) Predicting September sea ice: Ensemble skill of the SEARCH Sea Ice Outlook 2008-2013, Geophysical Research Letters, 41, 2411-2418, doi:10.1002/2014GL059388
Stroeve, J. C.; Schroeder, D.; Tsamados, M.; Feltham, D. (2018) Warm winter, thin ice? The Cryosphere, 12, 1791-1809, doi: 10.5194/tc-12-1791-2018
Zhang, J., Lindsay, R., Schweiger, A., Steele, M. (2013) The impact of an intense summer cyclone on 2012 Arctic sea ice retreat, Geophys. Res. Lett., 40, 1-7, doi:10.1002/grl.50190