
Arctic and Antarctic end of season report - October 2019
In-depth analysis of the Arctic sea ice summer minimum and Antarctic sea ice winter maximum extent for 2019
Summary
- Sea ice extent for September 2019 was 4.31 million square km, the 3rd lowest in the satellite era (after September 2012 and September 2007).
- The minimum daily sea ice extent for 2019 was 4.15 million square km, recorded on 16th September. This was the joint-second lowest minimum on record (equal to that recorded on 15th September 2007), the lowest having been 3.39 million square km, recorded on 14th September 2012.
- Extent was low in all regions of the Arctic except the Central Arctic and in the vicinity of Fram Strait.
- Summer 2019 was exceptionally warm in the Arctic, with the NCEP reanalysis suggesting that upper air temperatures were the warmest on record.
- The summer saw frequent strong occurrences of the Arctic Dipole Anomaly, a pattern characterised by high pressure over Greenland and the North American Arctic, which has been historically associated with above average sea ice loss. However, there were several periods of starkly contrasting weather, with unsettled, stormy conditions over much of the Arctic, particularly during mid-June and much of August.
- September sea ice extent fell close to the centre of all of September sea ice extent predictions submitted in June, July and August, for the Sea Ice Outlook (SIO).
- Antarctic sea ice recorded a maximum extent of 18.40 million square km on 28th September, which, if not subsequently exceeded, will represent the 10th lowest in the satellite era.
September sea ice extent
Arctic sea ice extent for the month of September 2019 was 4.31 million square km according to the HadISST1.2 dataset (Rayner et al, 2003). This was the 3rd lowest September extent in the satellite era, after 3.56 million square km in September 2012 and 4.20 million square km in September 2007. It was 2.08 million square km below the 1981-2010 average, but only 0.05 million square km below the long-term linear trend (Figure 1). Extent was very low in all regions of the Arctic except the Central Arctic and in the vicinity of Fram Strait (Figure 2).
Figure 1. September Arctic sea ice extent during the satellite era, according to HadISST1.2, with linear trend indicated.
Figure 2. Arctic sea ice extent in September 2019, compared to the record low year of 2012 and the 1981-2010 average, with regions named in the text labelled. Data are from HadISST1.2.
Melt season review
Summer 2019 was exceptionally warm in the Arctic (Figure 3). As measured by temperatures at 925mb (about 750m above sea level), the May-August period was the warmest on record over the Arctic Ocean, at 2.3°C above the 1981-2010 average according to the NCEP reanalysis (Figure 4). Some regions of the Central Arctic saw temperatures that were, on average, more than 4°C higher than normal.
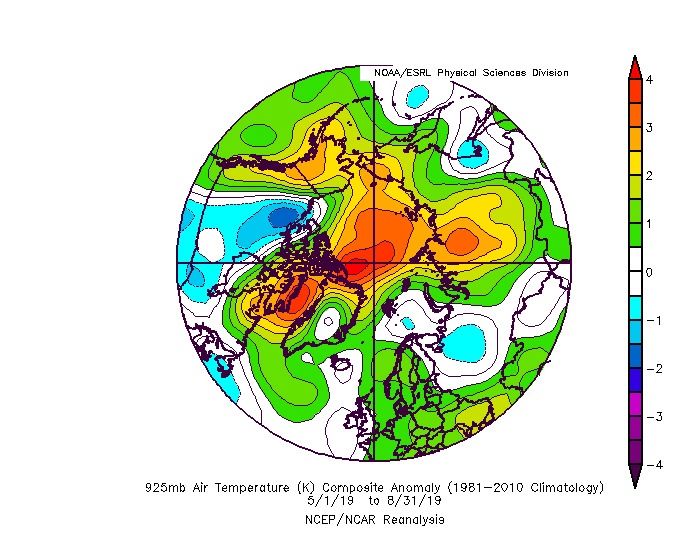
Figure 3. Temperature anomaly at 925mb (about 750m above sea level), for May-August 2019, relative to the 1981-2010 average. Data are from the NCEP reanalysis.
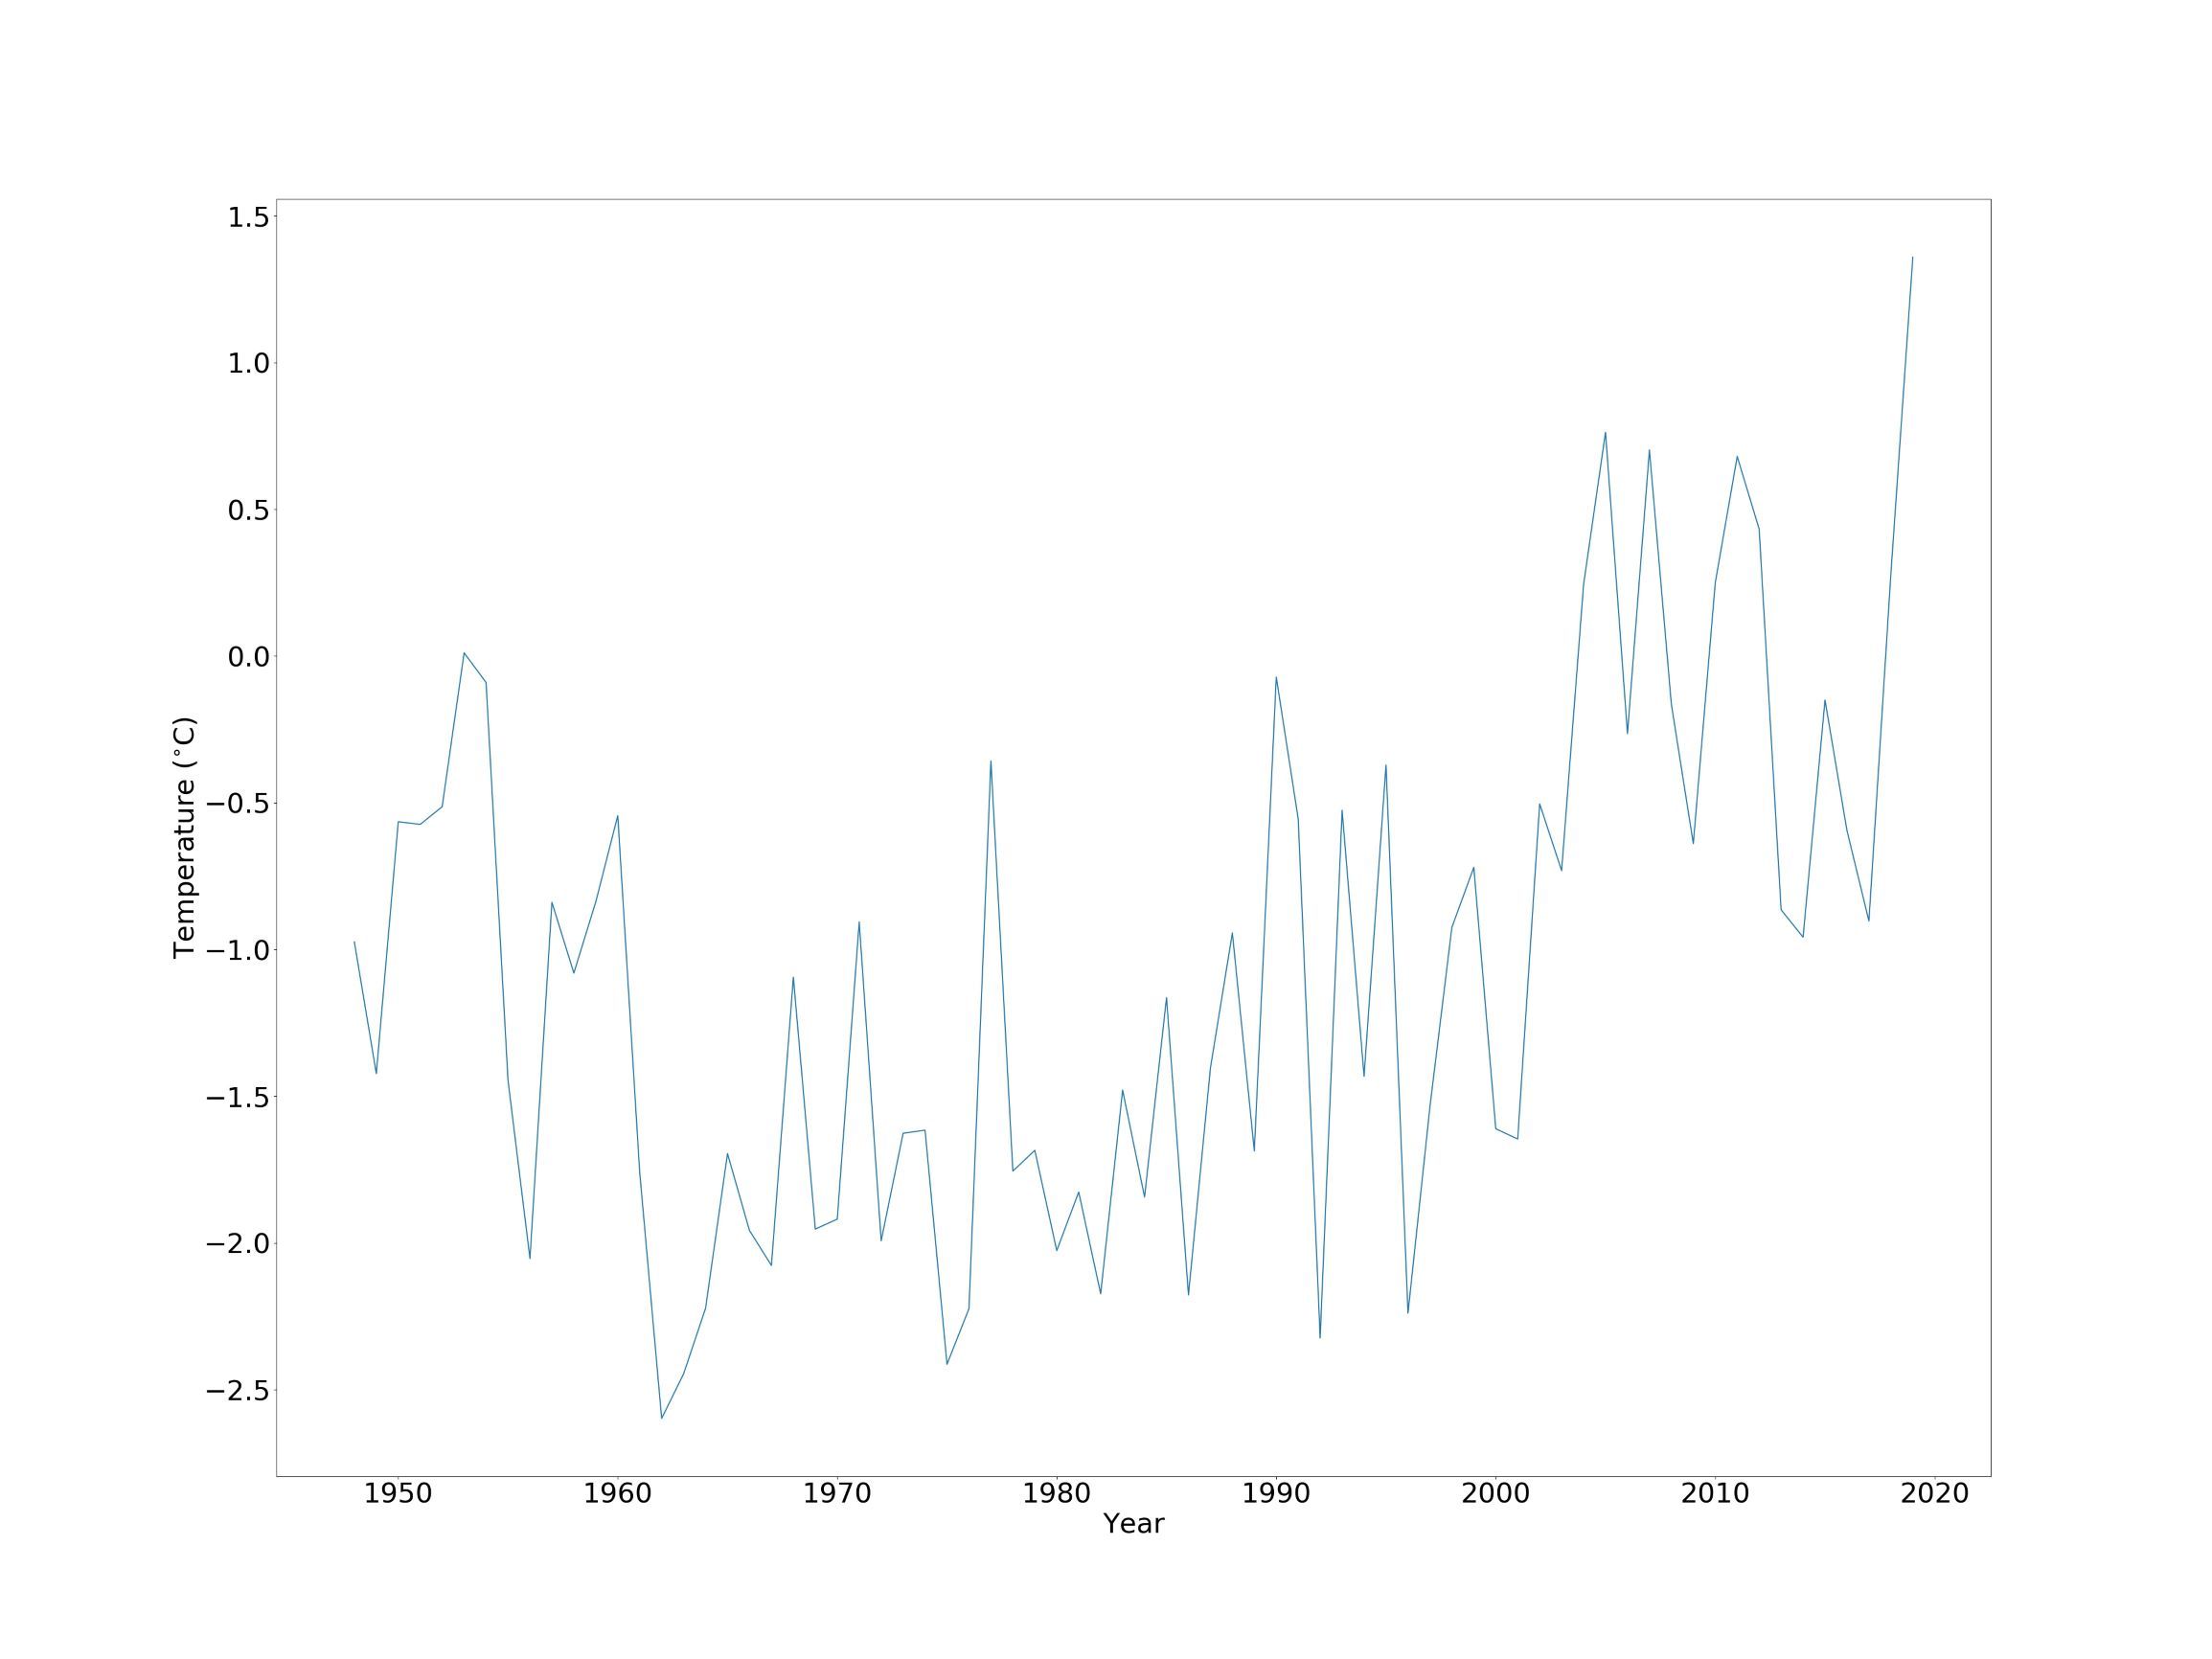
Figure 4. Average May-August temperature at 925mb over the Arctic Ocean region, for the years 1948-2019. Data are from the NCEP reanalysis.
The average sea level pressure anomaly of the summer saw a weak pattern of high pressure over Greenland and the North American sector of the Arctic. This pattern is similar to the Arctic Dipole Anomaly, which has historically been associated with elevated levels of Arctic sea ice loss (e.g. Wang et al, 2009).
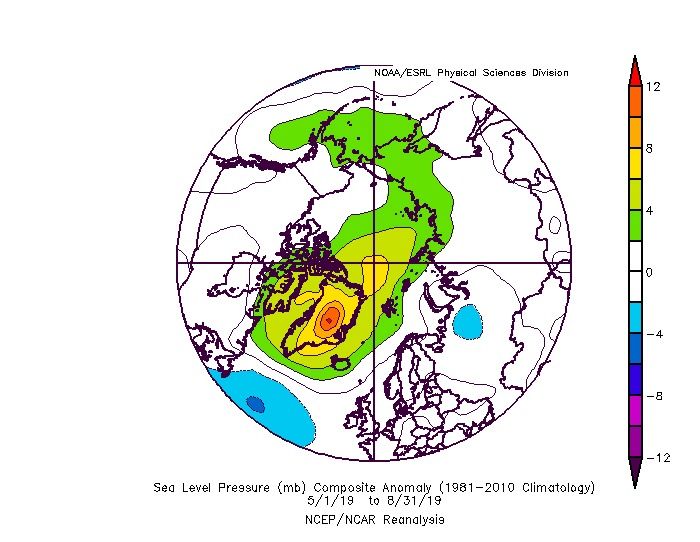
Figure 5. Mean sea level pressure anomaly for May-August 2019 relative to the 1981-2010 average. Data are from the NCEP reanalysis.
The relatively weak pattern seen in the May-August average conceals much variation during the summer. May and July, the months which saw fastest sea ice loss relative to average, saw a very strong manifestation of the Arctic Dipole Anomaly with exceptionally high temperature anomalies over much of the Central Arctic, in some places exceeding 7°C. In June and August, during which average sea ice loss was nearer average, a rather different pattern was common, with higher pressure over the East Siberian and Laptev Seas, but more cyclonic conditions in the central Arctic Ocean – particularly during mid-June and much of August. This drove the transport of warm air over the seas north of Western Siberia but allowed nearer average temperatures elsewhere in the Arctic Ocean.
Assessment of predictions
During the summer, the Sea Ice Prediction Network (SIPN) collates predictions of September Arctic sea ice extent from scientific centres around the world and publishes these predictions in a series of Sea Ice Outlooks (SIO), in June, July and August. In 2019, as in 2018, the observed September extent fell inside the central ranges of the distribution of predictions for all three outlooks, with the median prediction within 0.2 million square km of the eventual extent (Figure 6). This is consistent with a finding by Stroeve et al. (2014) that the SIO predictions tend to be more skilful in years for which sea ice extent was close to the linear trend.
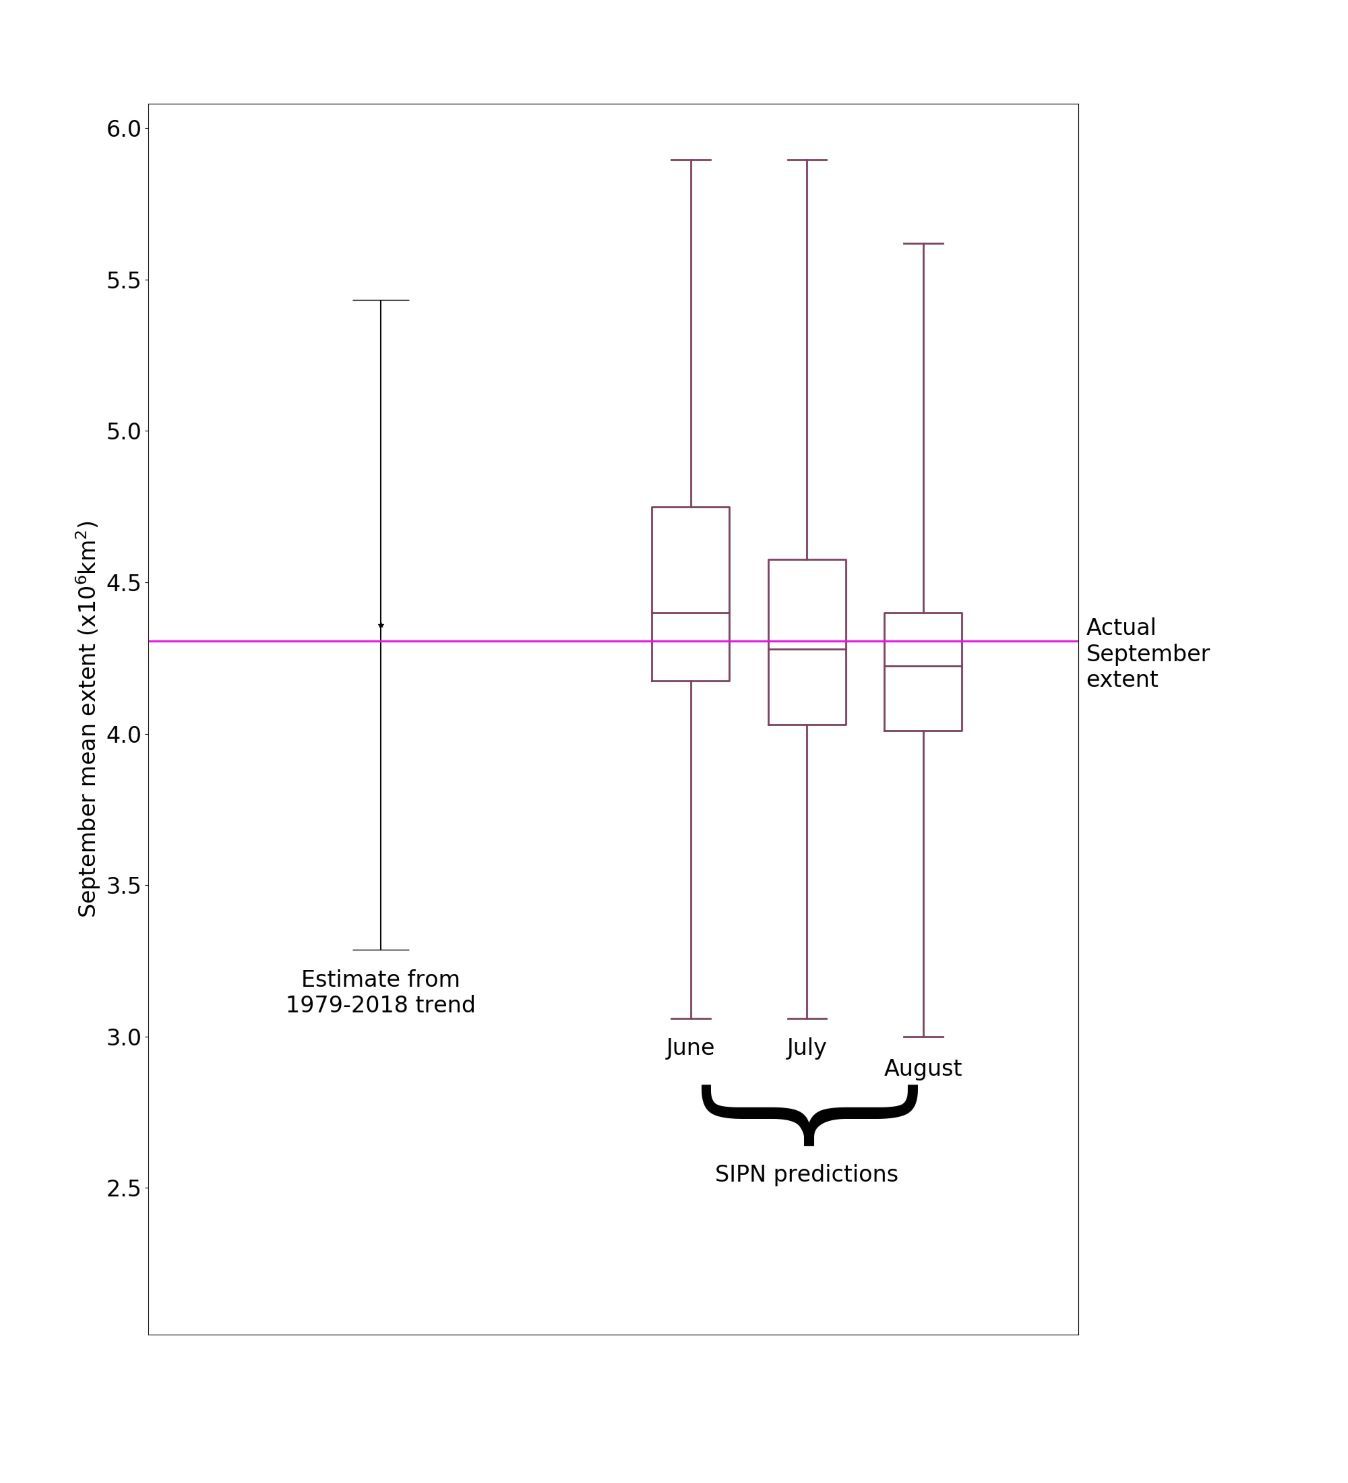
Figure 6. Arctic sea ice extent for September 2019 according to HadISST1.2 (pink line), compared to an extrapolation from the long-term linear trend and predictions submitted to the three SIO reports (maximum, minimum, median and quartiles from each distribution shown).
Antarctic sea ice extent
Antarctic sea ice usually reaches its maximum extent during September. However, the maximum extent to date, 18.40 million square km, was recorded as recently as 28th September, and sea ice extent as of 12th October had fallen to only 18.18 million square km. Hence it is not yet certain that extent will not rise further. An extent of 18.40 million square km would represent the 10th lowest annual maximum Antarctic sea ice extent in the satellite record (the lowest having been 17.89 million square km in 1986), and would be 0.30 million square km below the 1981-2010 average.
Figure 7. Antarctic sea ice extent for 2019 and other recent years, plus the record low year of 1986, compared to the 1981-2010 average, with 1 and 2 standard deviation intervals indicated. Data are from NSIDC.
Antarctic sea ice extent has mostly been at low levels since autumn 2016, although the anomaly varies between regions. In September 2019, areas of lower than average extent in the eastern Weddell Sea and Bellingshausen Sea were partly counterbalanced by areas of higher than average extent on the other side of the Antarctic, in the Indian Ocean and Western Pacific sectors (Figure 8).
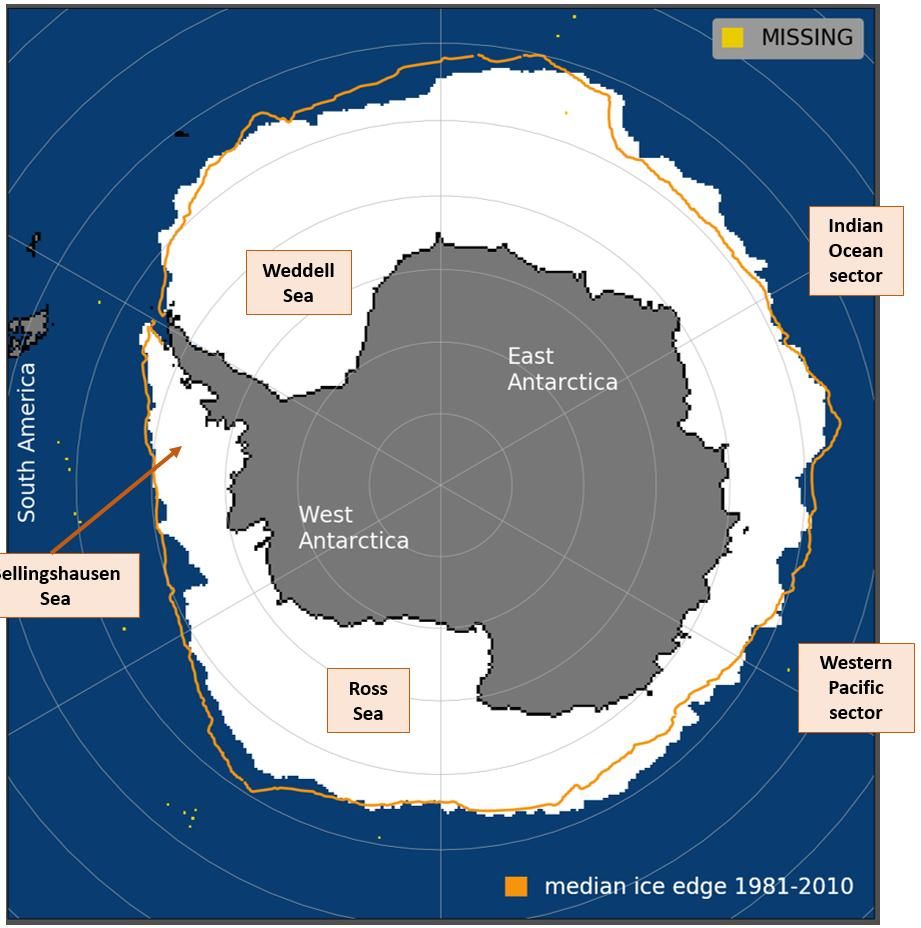
Figure 8. Antarctic sea ice coverage on 28th September 2019, with average September sea ice extent from 1981-2010 indicated in orange. Data are from NSIDC.
References
Rayner, N. A.; Parker, D. E.; Horton, E. B.; Folland, C. K.; Alexander, L. V.; Rowell, D. P.; Kent, E. C.; Kaplan, A. (2003) Global analyses of sea surface temperature, sea ice, and night marine air temperature since the late nineteenth century J. Geophys. Res. Vol. 108, No. D14, 4407 10.1029/2002JD002670
Stroeve, J. C.; Hamilton, L. C.; Bitz, C. M.; Blanchard-Wrigglesworth E. (2014) Predicting September sea ice: Ensemble skill of the SEARCH Sea Ice Outlook 2008-2013, Geophysical Research Letters, 41, 2411-2418, doi:10.1002/2014GL059388
Wang, J.; Zhang, J.; Watanabe, E.; Ikeda, M.; Mizobata, K., Walsh, J. E.; Bai, X.; Wu, B. (2009) Is the Dipole Anomaly a major driver to record lows in Arctic summer sea ice extent?, Geophys. Res. Let., 36, 5, doi:10.1029/2008GL036706