Briefing on Arctic and Antarctic sea ice - July 2019
Alex West and Ed Blockley
Summary
- Arctic sea ice extent is second lowest on record for the time of year. This follows three weeks of relatively warm weather in the Arctic, with an associated fast rate of ice melt.
- Predictions of September sea ice extent submitted to the Sea Ice Prediction Network point towards a relatively low extent, but only one prediction would be consistent with a new record low.
- A statistical prediction of September Arctic ice extent using up-to-date daily ice extent data produces the joint second-lowest September sea ice extent on record, suggesting that this year is likely to witness relatively severe sea ice melt.
- Hence while the eventual September ice extent will be strongly influenced by weather conditions for the remainder of the summer, the chance of a record low is higher than it has been in the previous few years
- Antarctic sea ice extent is currently third lowest on record for the time of year.
Current Arctic sea ice extent
Arctic sea ice extent on 15th July 2019 was 7.68 million square km according to data from the US National Snow and Ice Data Center (NSIDC). This is the second lowest value for this date on record, 1.89 million square km below the 1981-2010 average, and 0.07 million square km above the record low for this date, which occurred in 2011 (Figure 1).
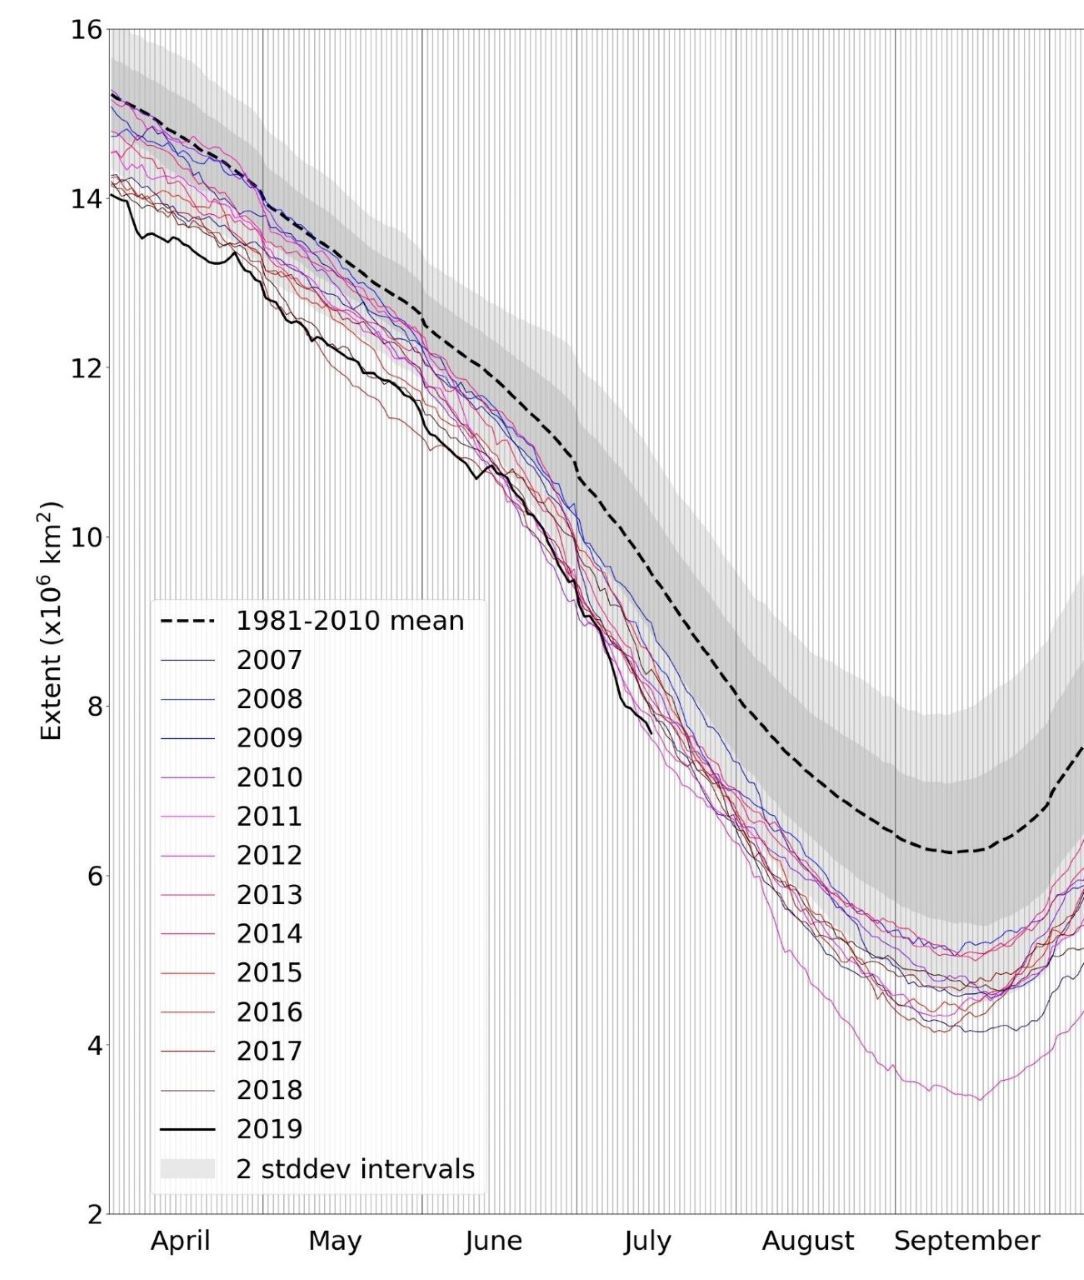 Figure 1: Daily Arctic sea ice extent for 2019, compared with recent years and the 1981-2010 average with ± 1 and 2 standard deviation intervals indicated by the shaded areas. Data are from the National Snow and Ice Data Center (NSIDC).
Extent was exceptionally low in all marginal seas of the Arctic except the East Siberian Sea, where it was close to the long-term average. Extent was also close to the long-term average in the Central Arctic.
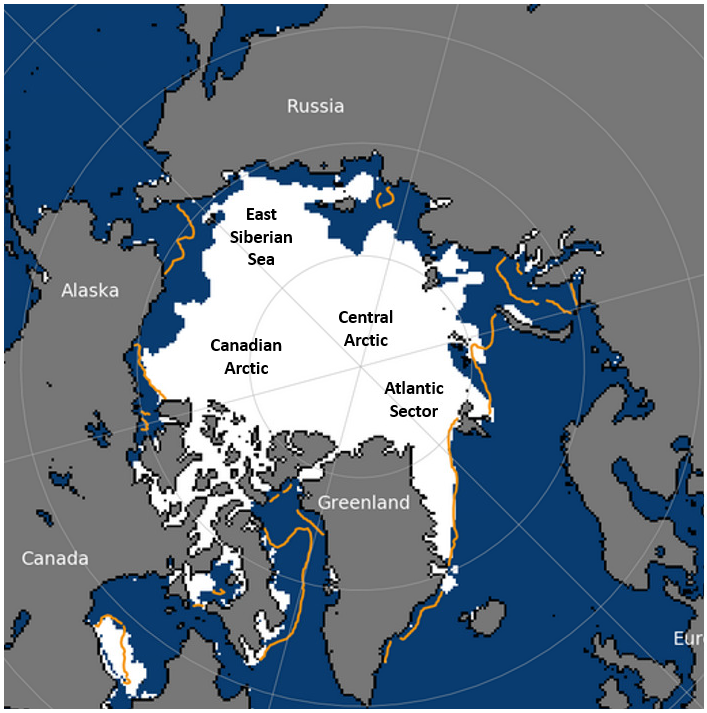
Figure 2: Arctic sea ice extent on 15th July 2019, with 1981-2010 average extent indicated in orange, and the regions referred to in the text labelled. Underlying map and data courtesy of NSIDC.
The recent fast rate of ice loss is associated with the predominance of very warm conditions in the Arctic from 20th June – 6th July (Figure 3a), with high pressure systems forming successively over the East Siberian Sea, the Canadian Arctic and the Atlantic sector, each bringing southerly winds with associated mild air. These high pressure systems have also acted to suppress Arctic cyclones, which tend to be associated with reduced ice loss due to ice divergence and increased cloudiness. Notably, from 7th-19th June (and also since 7th July) Arctic weather conditions were stormier, with very warm temperature anomalies less extensive (Figure 3c-d); this is likely to have strongly influenced the (much slower) rate of ice loss during this period.
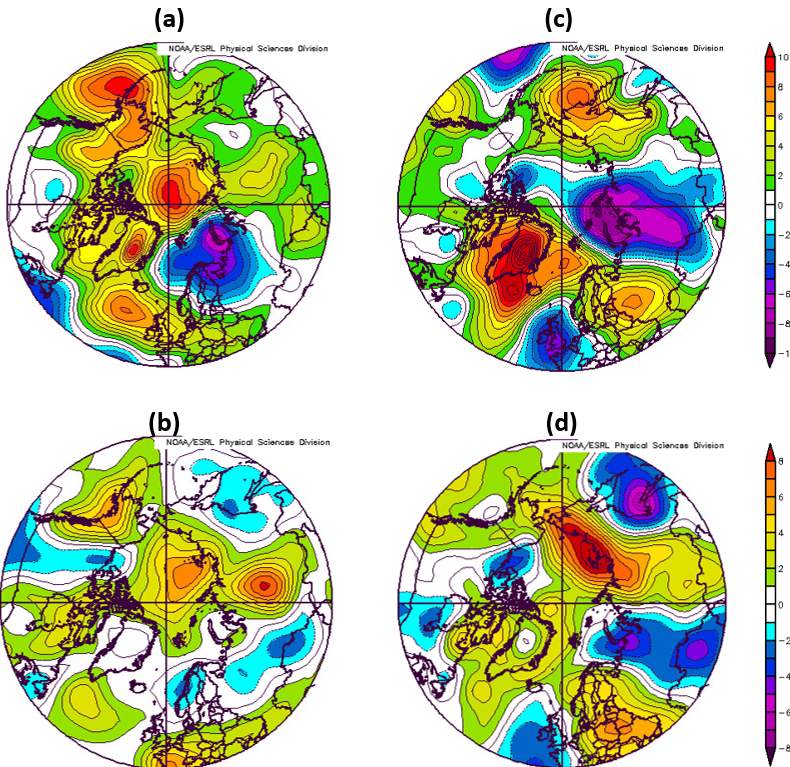
Figure 3: (a) Mean sea level pressure anomaly; (b) air temperature anomaly at 925mb, for 20th June – 6th July. (c), (d) show the same for the period 7th-19th June. Anomalies are relative to the 1981-2010 average. Data are from the NCEP reanalysis.
June 2019 in context
Average sea ice extent for the month of June 2019 was 10.85 million square km according to the HadISST1.2 dataset (Rayner et al., 2003). This is the fourth lowest June extent on record (the lowest was 10.58 in 2016), 1.02 million square km below the 1981-2010 average, and 0.04 million square km below the long-term linear trend (Figure 4).
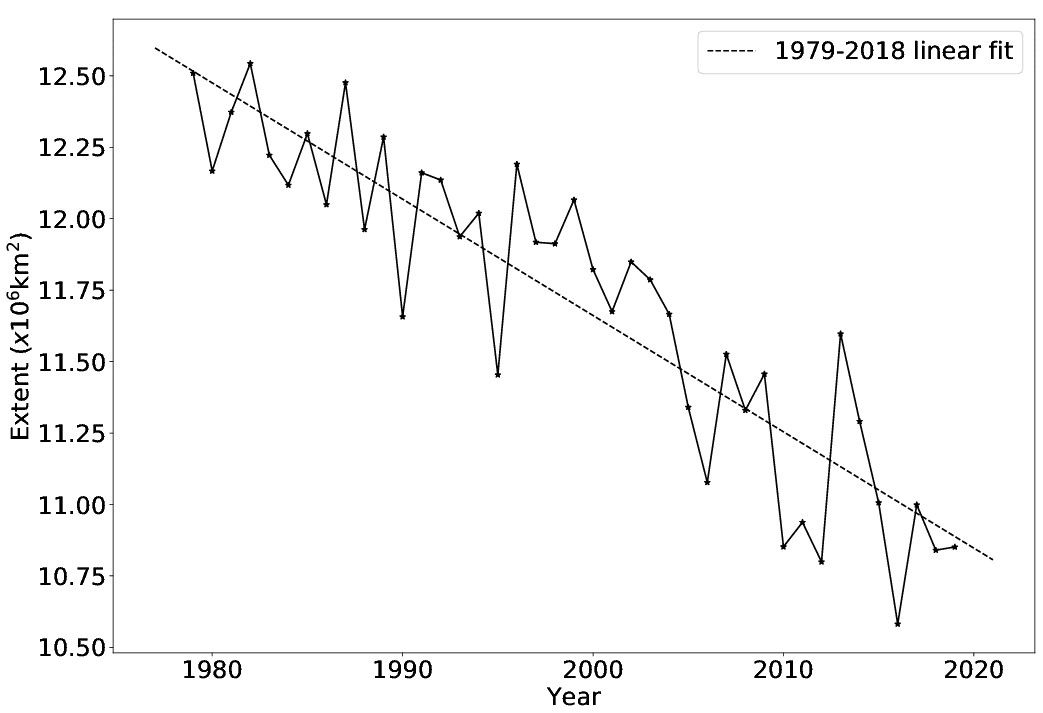
Figure 4: Average June Arctic sea ice extent according to the Hadley Centre Sea Ice and Sea Surface Temperature (HadISST) 1.2 dataset (Rayner et al, 2003).
The average rate of sea ice loss during June was 68,000 square km per day according to data from NSIDC, substantially faster than the 1981-2010 average of 59,000 square km per day but only the thirteenth fastest rate of June ice loss in the satellite record (the fastest being 101,000 square km per day in 2012).
Outlook for September
A number of predictions of this year’s seasonal minimum (September) ice extent are displayed in Figure 5, and described below:
- The Sea Ice Prediction Network (SIPN) July Outlook report includes 31 predictions of mean September ice extent based on a variety of methods and from centres around the world. The predictions range from 3.08 to 5.9 million square km, with a median of 4.40 million square km. Only the lowest prediction would indicate a record low September extent (the current record is 3.6 million square km, in 2012).
- Statistical predictions based on an extrapolation of the linear trend for the entire satellite period from 1979-2018 (black), and most recent 15 years (red) suggest a mean September sea ice extent of 4.36 (±1.08) and 4.30 (± 1.08) million square km respectively.
- There is a reasonable correlation between mean September ice extent and the extent for 1st – 15th July (the most recent 15 days of data available at the time of writing). Applying simple statistical methods to the anomalies for these dates gives a prediction of September mean extent of 4.22 (± 0.78) million square km, indicated in blue on Figure 5.
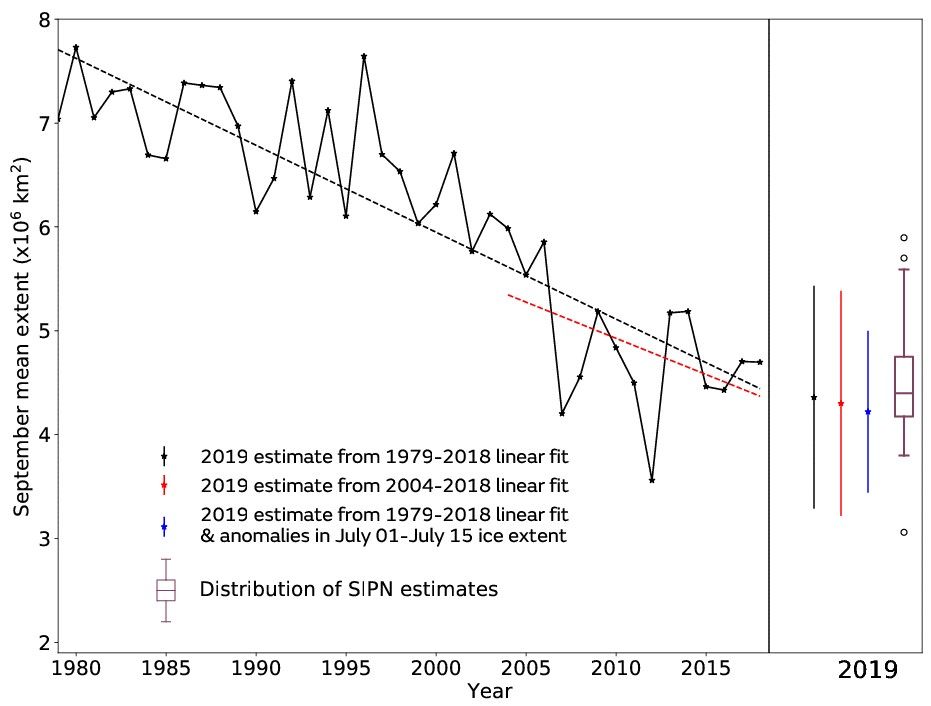 Figure 5: September median Arctic sea ice extent since satellite records began in 1979 from the HadISST1.2 dataset (Rayner et al., 2003), with predictions from the SIPN Sea Ice Outlook and statistical predictions for September 2019. For the statistical predictions, error bars represent twice the standard deviation of September mean ice extent about the trend lines with respect to which the estimates are taken. The Sea Ice Outlook is shown as a boxplot indicating range, median and quartiles of the 33 predictions submitted. Values more than 1.5 interquartile ranges from the first and third quartiles are shown as outliers.
Although the SIPN predictions may appear at first sight to suggest that a new record low September extent is unlikely this year, there remains a high degree of uncertainty at this point of the melt season. Notably, the statistical prediction of September extent (4.22 million square km) is considerably lower than at the same point last year (4.96 million square km), and is only marginally above the second lowest September extent on record (4.20 million square km, recorded in 2007). This is due to the low ice extent of the past three weeks, information which was not available when the SIPN predictions were compiled. While the September minimum extent will be heavily dependent on the Arctic weather conditions over the rest of the summer, the chance of a record low is higher this year than it has been in the previous few years.
Antarctic sea ice state
Antarctic sea ice extent on 15th July was 15.26 million square km (Figure 6). This is the second lowest value for this date on record, 0.67 million square km below the 1981-2010 average, and 0.25 million square km above the lowest value for this date, which occurred in 2017. Extent remained particularly low relative to average in the Indian Ocean sector, and in the region between the Ross Sea and the Bellingshausen Sea (Figure 7).
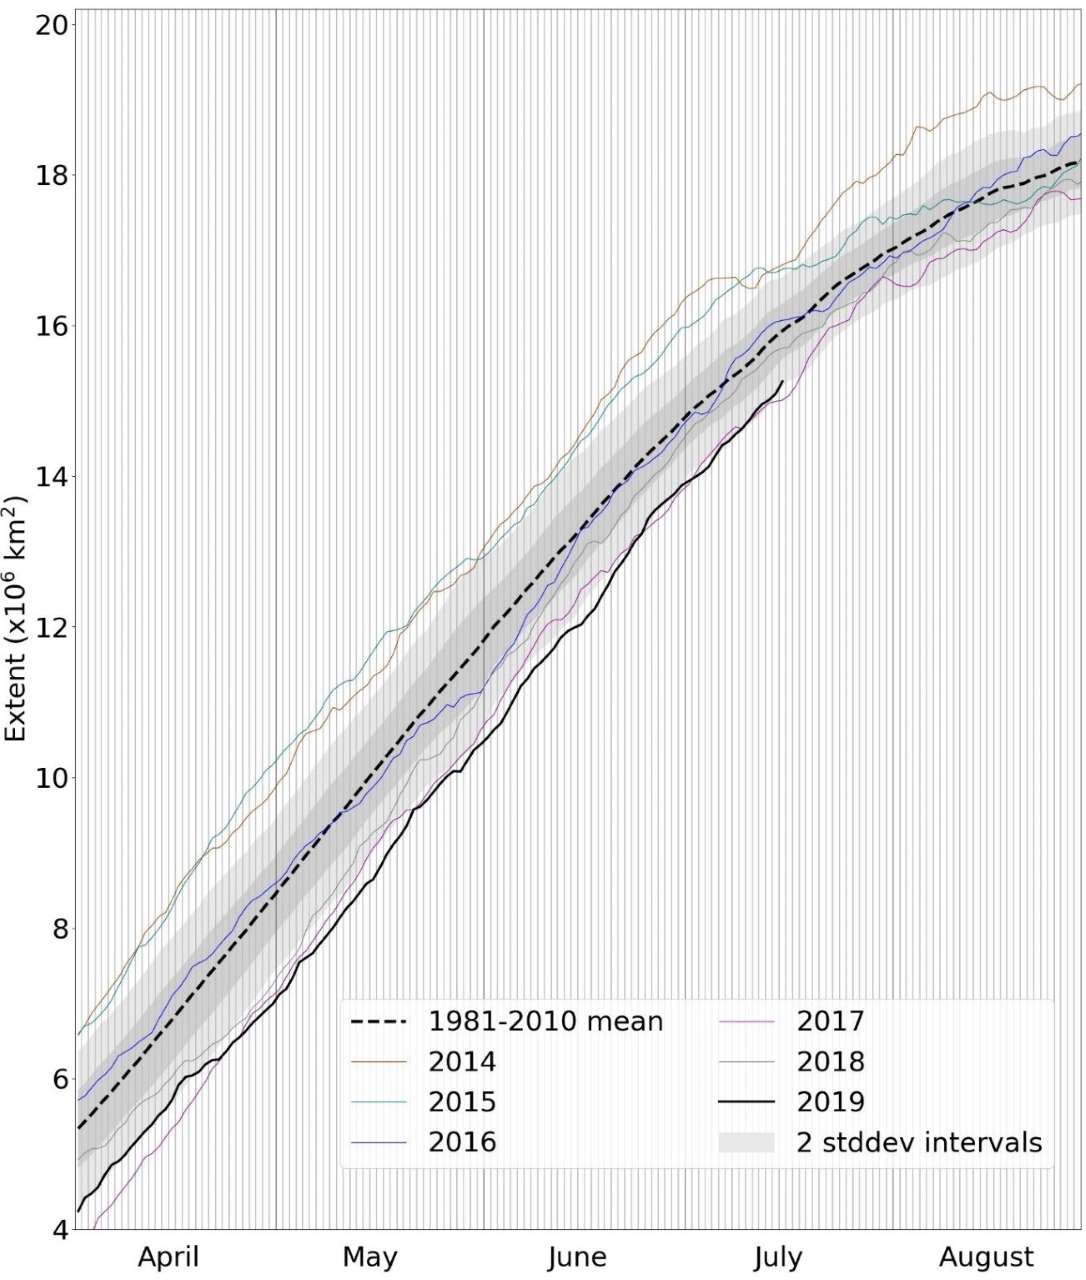
Figure 6: Daily Antarctic sea ice extent for 2019, compared with recent years and the 1981-2010 average, with ± 1 and 2 standard deviation intervals indicated by the shaded areas. Data are from NSIDC.
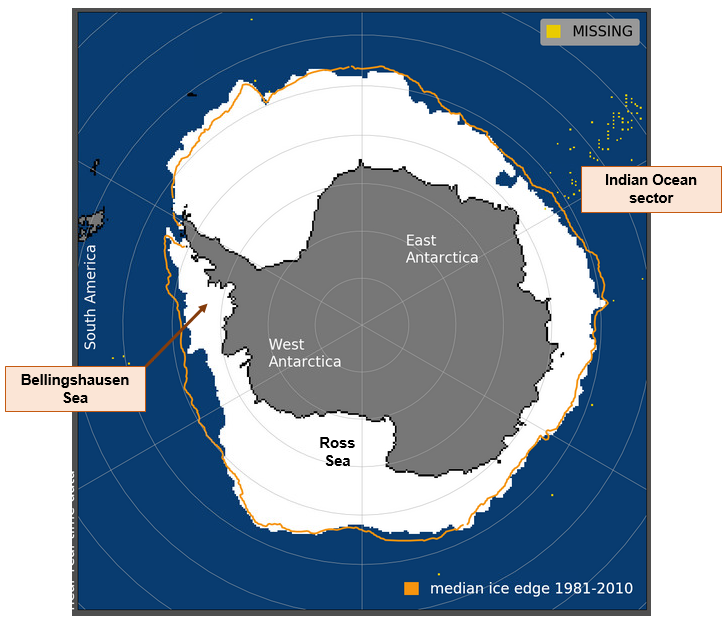
Figure 7: Antarctic sea ice extent on 15th July 2019, with 1981-2010 average extent indicated in orange, and regions referred to in the text labelled. Underlying map and data courtesy of NSIDC.
References
Rayner, N. A.; Parker, D. E.; Horton, E. B.; Folland, C. K.; Alexander, L. V.; Rowell, D. P.; Kent, E. C. and Kaplan, A.: Globalanalyses of sea surface temperature, sea ice, and night marine air temperature since the late nineteenth century. J. Geophys.Res. Vol. 108, No. D14, 4407 10.1029/2002JD002670, 2003.