
Briefing on Arctic and Antarctic sea ice - June 2020
Alex West and Ed Blockley
Summary
- Arctic sea ice extent is currently 4th lowest for the time of year; extent is particularly low in the Barents and Kara Seas, following above-average sea ice loss during May.
- The preceding winter was very stormy in the Arctic; conditions were mild but not exceptionally so. The spring was also unsettled and very mild.
- Arctic sea ice thickness at the end of winter is likely to have been thinner than most recent years in the Siberian seas but thicker north of the Fram Strait and Greenland.
- Reliable predictions of September extent cannot be made at this point in the melt season. Statistical predictions based on daily extent achieve some skill by mid-July.
- Antarctic sea ice extent has returned to a level close to the long-term average following 3 years of below-average extent, due to strong ice growth in the Ross and Weddell Seas earlier in the spring driven by offshore winds.
Current Arctic sea ice extent
Arctic sea ice extent on 12th June 2020 was 10.89 million square km. This was 1.11 million square km below the 1981-2010 average, and the 4th lowest extent on record for the time of year, the lowest having been 10.75 million square km recorded in 2019.
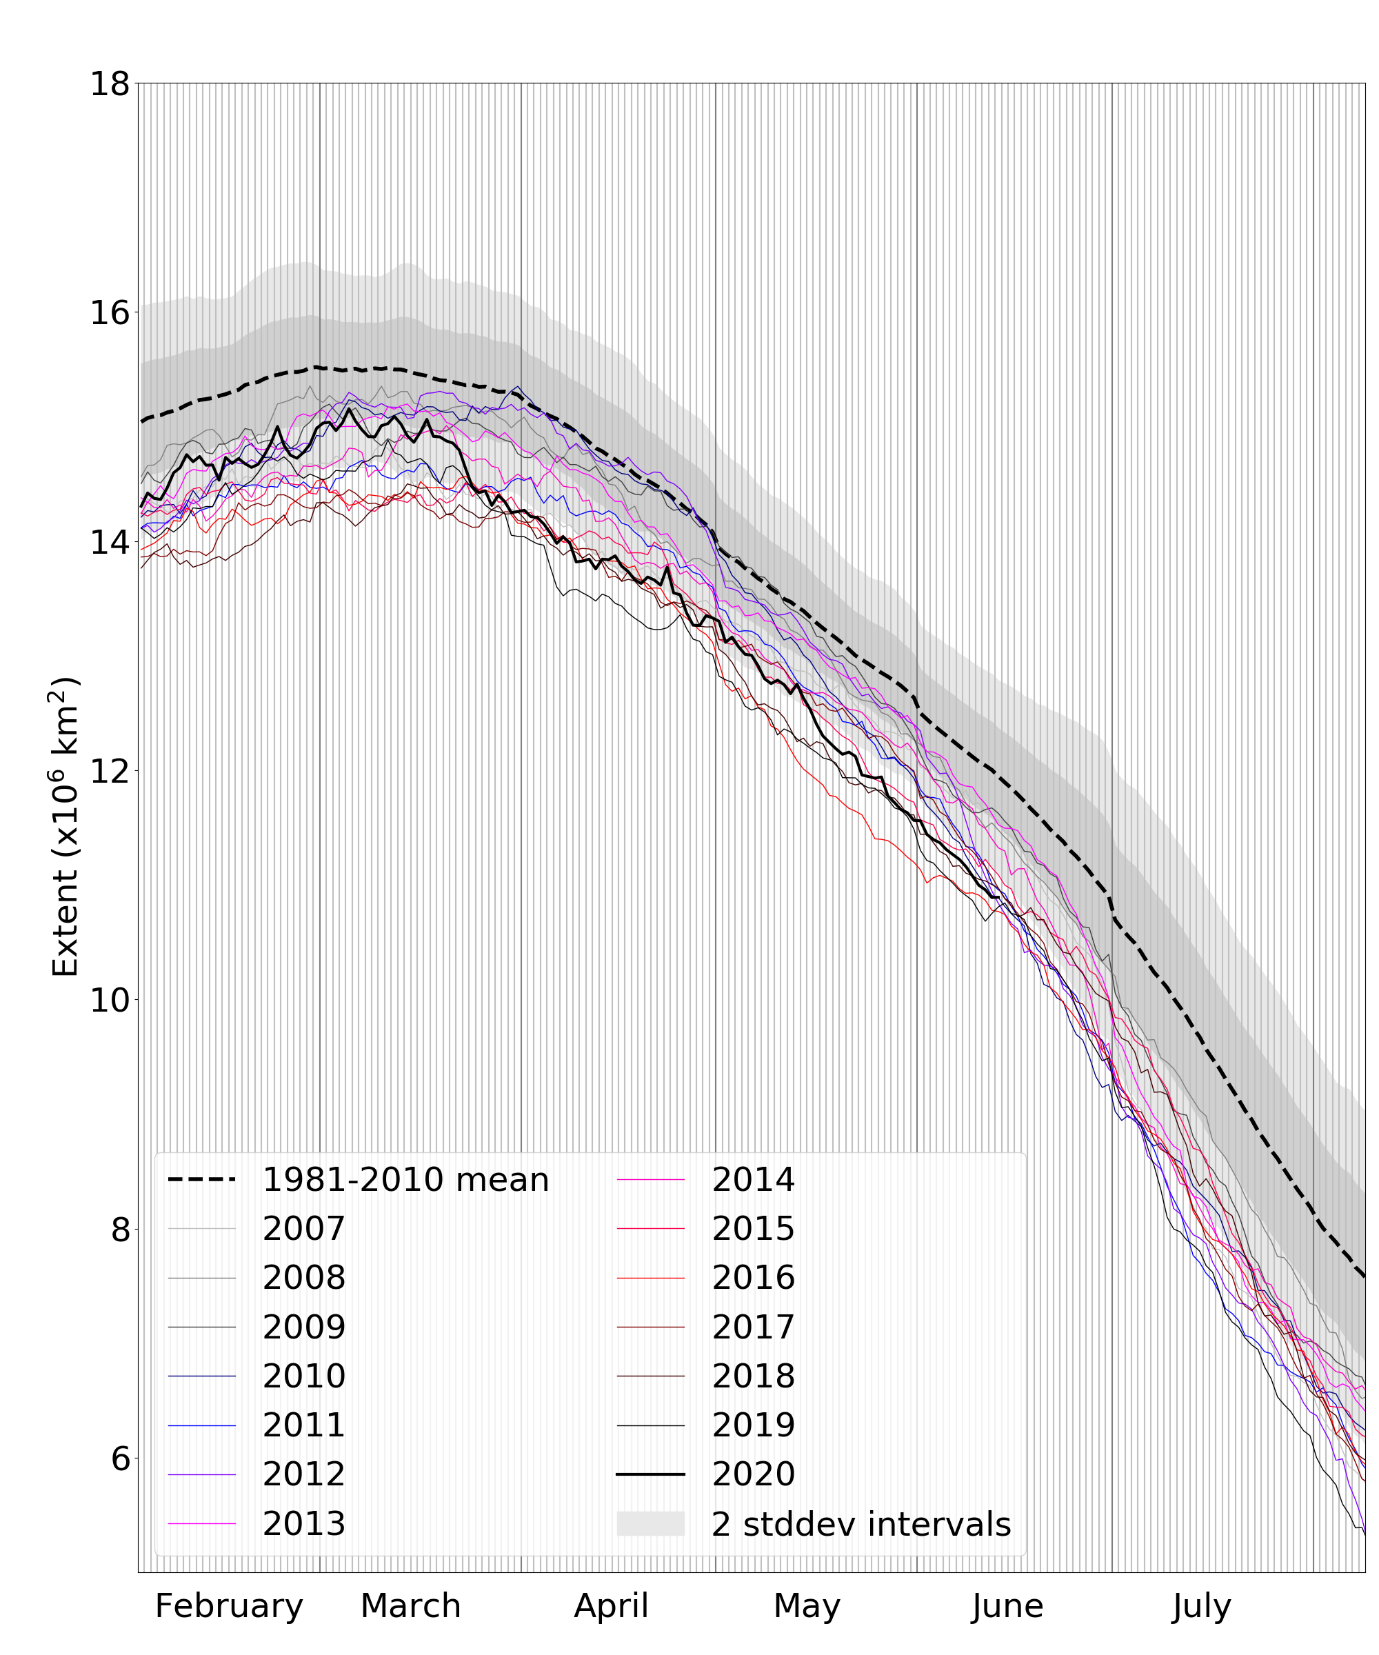
Figure 1. Daily Arctic sea ice extent for 2020, compared with recent years and the 1981-2010 average with ± 1 and 2 standard deviation intervals indicated by the shaded areas. Data are from the National Snow and Ice Data Center (NSIDC).
Extent was well below average in the Barents, Kara and Laptev Seas, and below average also in the Beaufort and Chukchi Seas. However, extent was near average in the East Siberian Sea and the Central Arctic, where melting had not yet commenced.
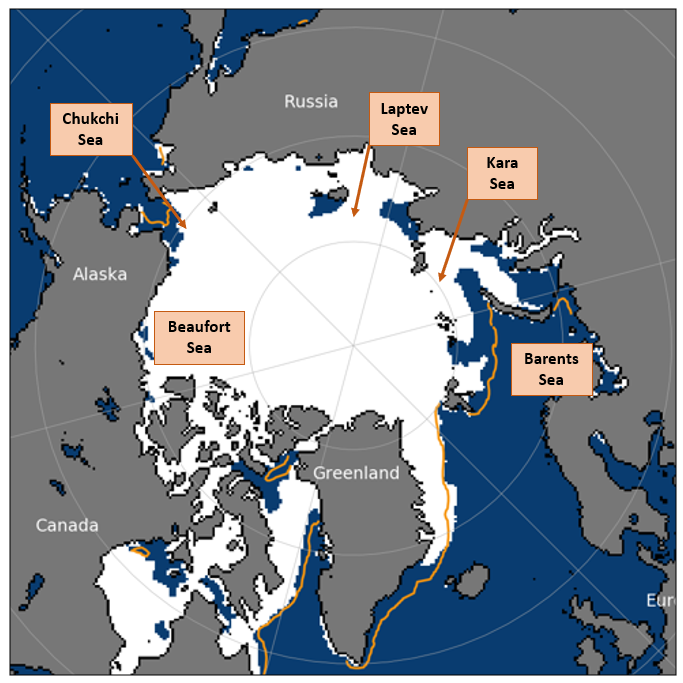
Figure 2. Arctic sea ice extent on 13th June 2020, with 1981-2010 average extent indicated in orange, and the regions referred to in the text labelled. Underlying map and data courtesy of NSIDC.
May 2020 in context
Average sea ice extent during May 2020 was 12.42 million square km according to the HadISST1.2 dataset (Rayner et al., 2003). This was 0.94 million square km below the 1981-2010 average, and 0.12 million square km below the long-term linear trend (Figure 3).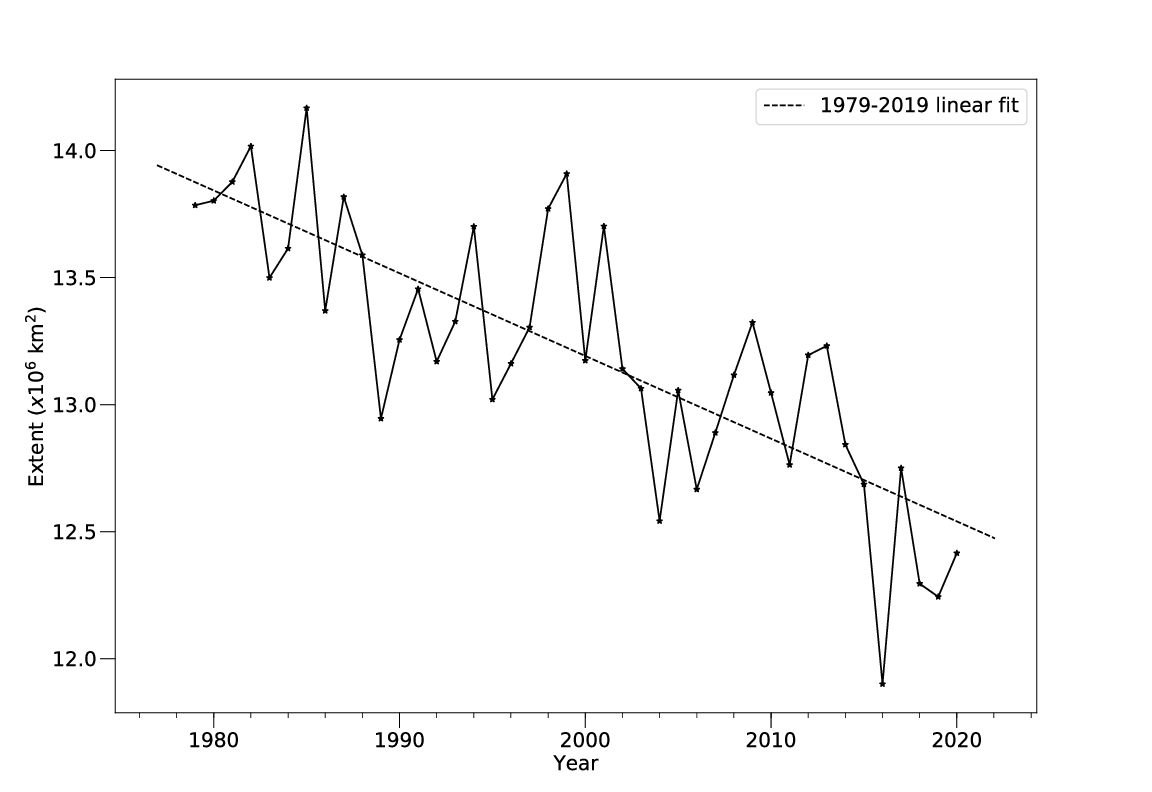
Figure 3. Average May Arctic sea ice extent according to the Hadley Centre Sea Ice and Sea Surface Temperature (HadISST) 1.2 dataset (Rayner et al., 2003).
The average daily rate of sea ice loss during May was 55,000 square km per day. This was somewhat faster than the 1981-2010 average of 47,000 square km per day, and was the 11th fastest rate of May ice loss on record.
Review of atmospheric drivers during winter and spring
Winter 2019-20 was unsettled and cyclonic in the Arctic (Figure 4a). The later part of the winter was especially stormy: notably, an intense storm crossed the central Arctic from 18th-22nd March, reaching a central pressure of below 970hPa. The stormy weather may have caused particularly strong ice motion in the Transpolar Drift Stream (a feature that transports sea ice across the Arctic Ocean from Siberia towards Greenland and the Fram Strait).
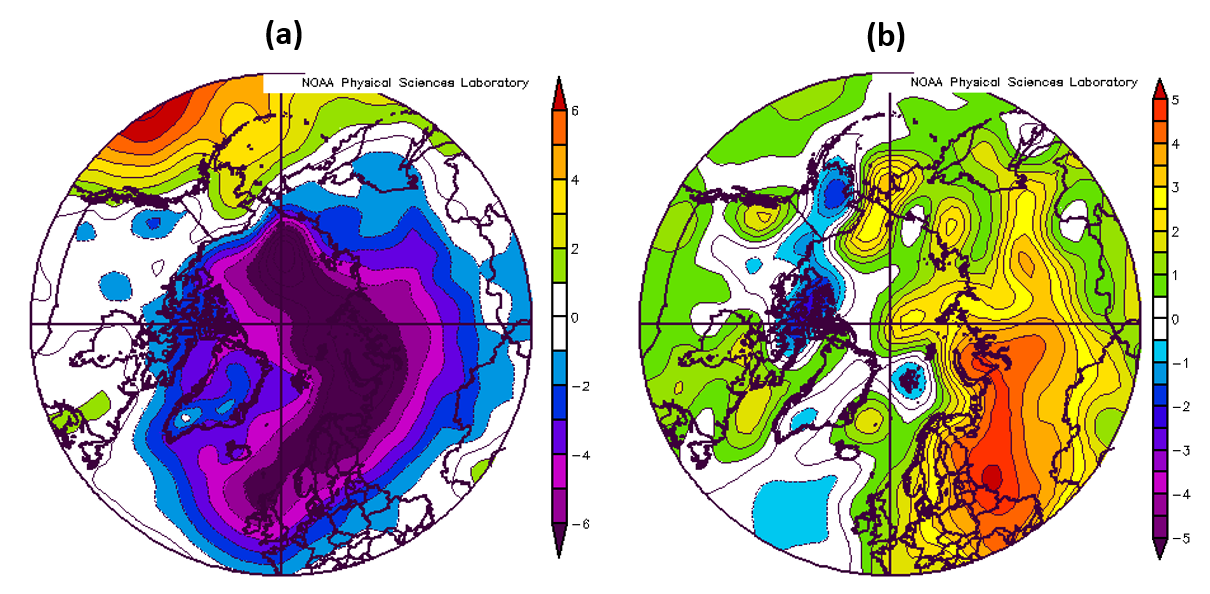
Figure 4. Surface meteorological conditions relative to the 1981-2010 average for November 2019 – March 2020: (a) mean sea level pressure anomaly (hPa); (b) surface air temperature anomaly (°C). Data are from the NCEP reanalysis (Kalnay et al, 1996).
Although mild relative to the 1981-2010 average, winter 2019-2020 was the coolest in the Arctic since 2012-2013, as measured by November-March average surface temperature north of 70°N (Figure 5). The Siberian side of the Arctic was warmer than average, particularly in the Kara and East Siberian Sea regions. However, much of the Beaufort Sea and Canada Basin saw near- or below-average temperatures (Figure 4b).
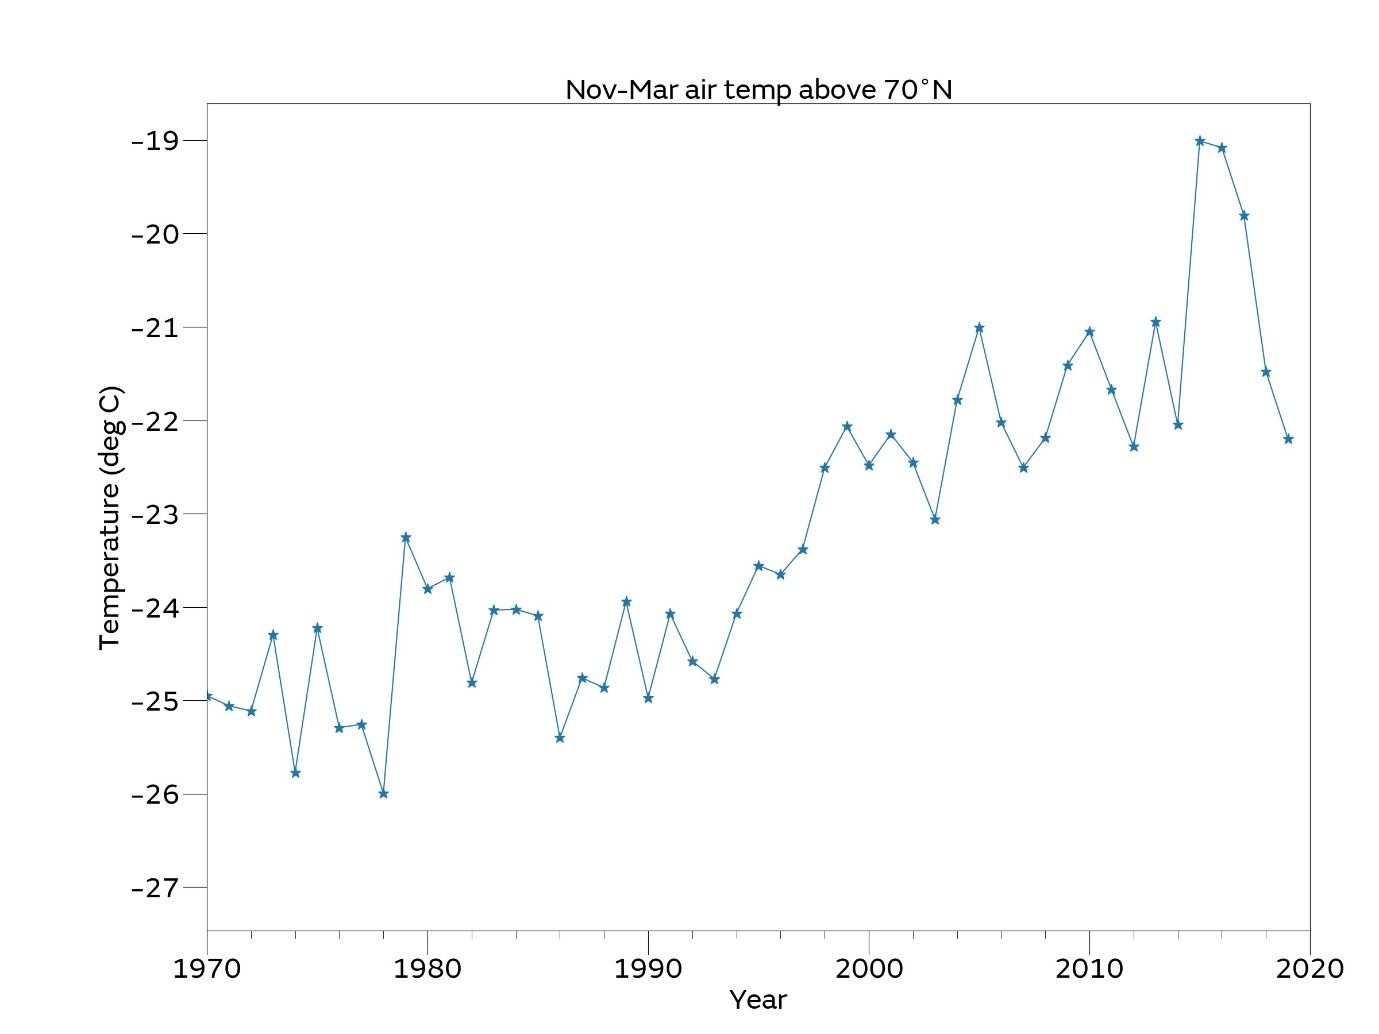
Figure 5. Average November-March surface air temperature (°C) for the region north of 70°N from 1970-present, according to the NCEP reanalysis.
April and May were also stormy and cyclonic in the Arctic, but warmer than average temperatures were much more widespread over the Arctic in these months: in fact, the April-May period was the second warmest on record north of 70°N according to the NCEP reanalysis. A recent study by Schreiber and Serreze (2020) suggests that Arctic storms tend to increase Arctic sea ice cover on average, although the effect is very modest during the spring.
Observations of sea ice thickness from CryoSat-2 during April suggest increased sea ice thickness north of Fram Strait, Greenland and the Canadian Arctic Archipelago relative to the 2016-2019 average, but decreased ice thickness in many other parts of the Arctic (Figure 6). Estimates of ice thickness from the forced ice-ocean model PIOMAS during May (Schweiger et al., 2011) show a similar picture of increased thickness near Greenland, but areas of decreased thickness are more concentrated close to the Siberian coast. The pattern of thicker ice near Greenland is likely related to the stronger transport of ice across the Arctic from Siberia to the Fram Strait observed this winter.
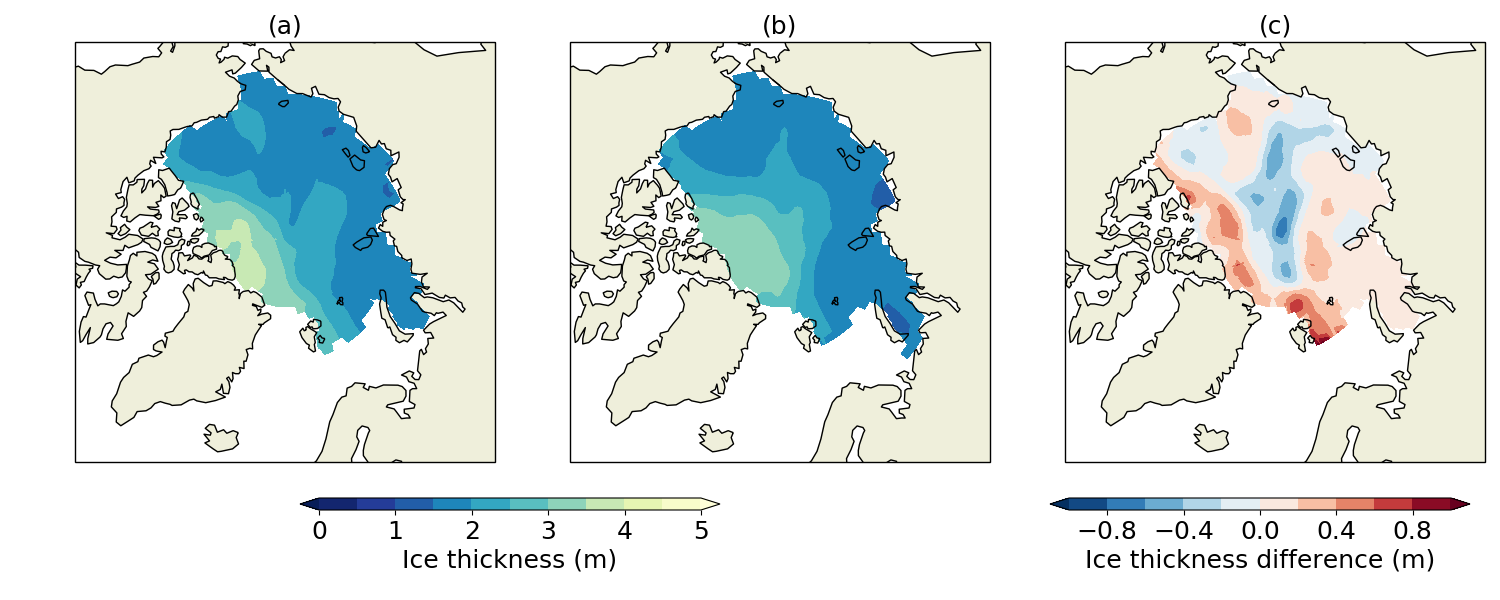
Figure 6. (a) Ice thickness in April 2020; (b) 2016-1019 average April ice thickness; (c) April 2020 ice thickness anomaly relative to 2016-2019. Data from CryoSat-2 radar altimetry (Kurtz and Harbeck, 2017).
Outlook for September
There is no significant correlation between ice extent in mid-June and the seasonal minimum extent in September, as the severity of summer melt is heavily dependent on Arctic weather conditions. Hence it is not possible to predict September sea ice extent with any confidence at this point in the season. However, statistical predictions based on daily extent do achieve some skill by mid-July.
Antarctic sea ice state
Antarctic sea ice extent on 12th June 2020 was 12.97 million square km, 0.05 million square km below the 1981-2010 average (Figure 7). This follows unusually strong ice growth in the Ross and Weddell Seas during March which ended a 41-month period of below average Antarctic sea ice extent. The ice growth was driven by offshore winds associated with strong and persistent low pressure systems in these regions.
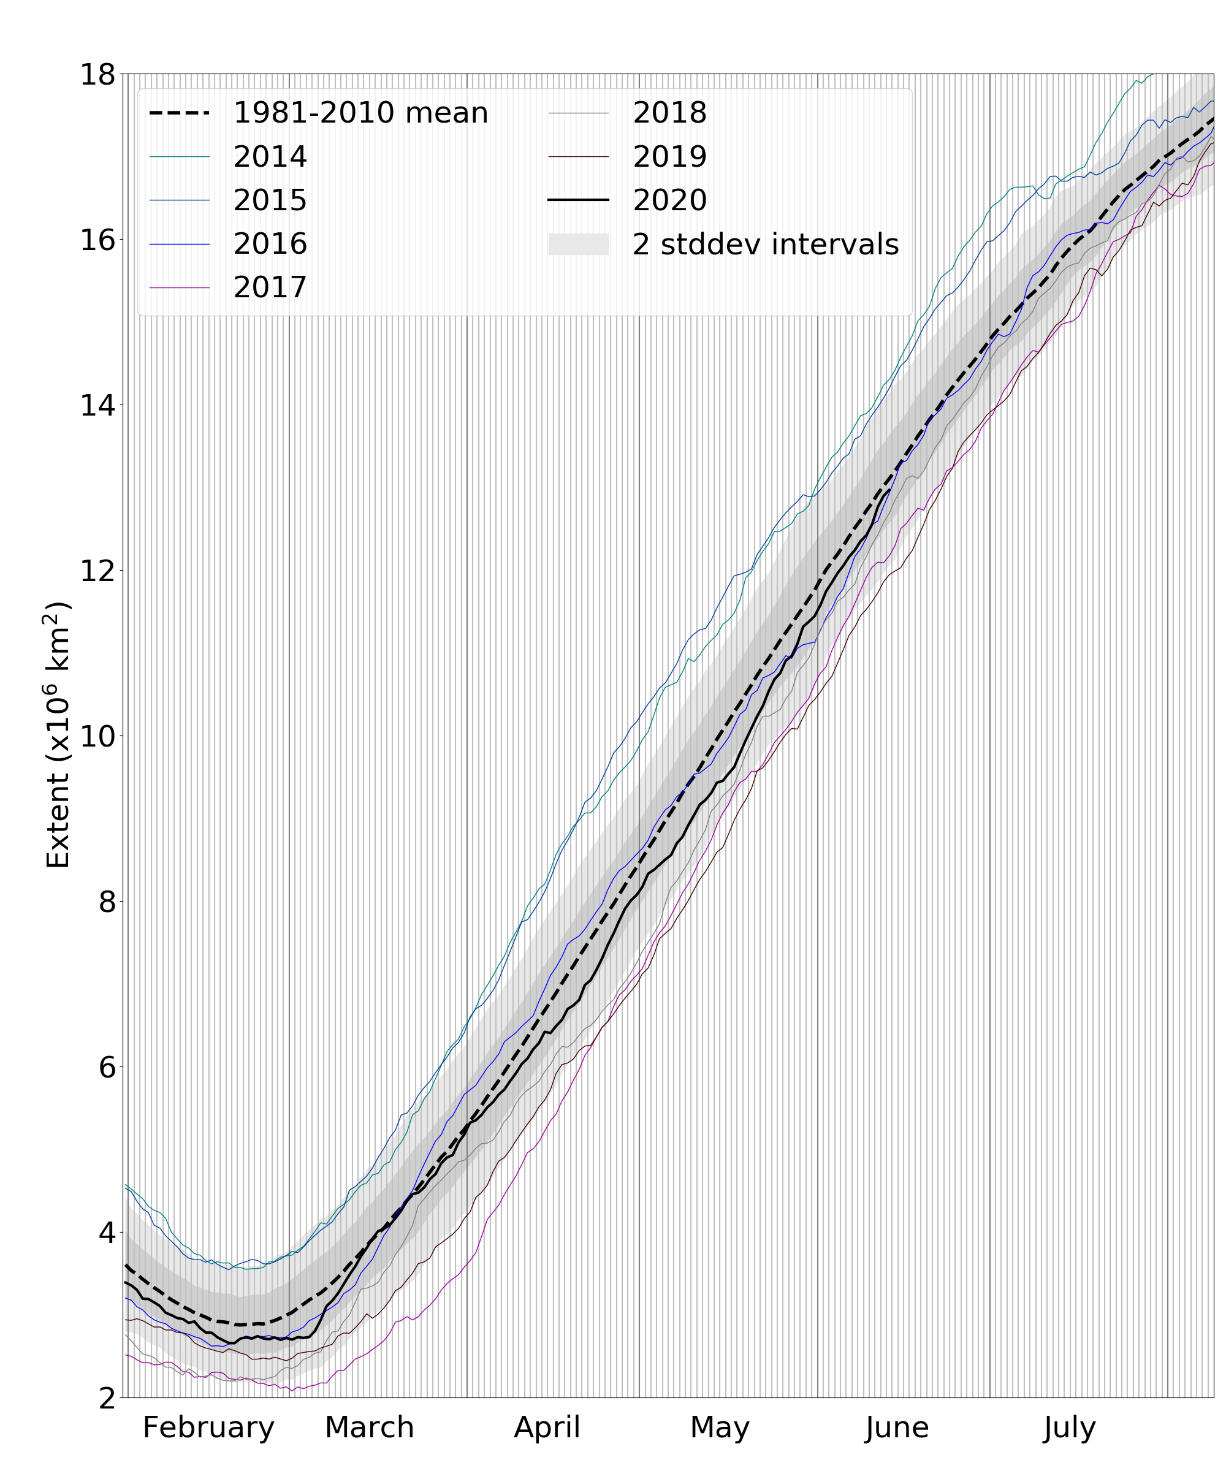
Figure 7. Daily Antarctic sea ice extent for 2020, compared with recent years and the 1981-2010 average with ± 1 and 2 standard deviation intervals indicated by the shaded areas. Data are from the National Snow and Ice Data Center (NSIDC).
The overall near-average extent conceals some spatial variability (Figure 8), with some sectors of the Southern Ocean displaying above-average extent, and others below average.
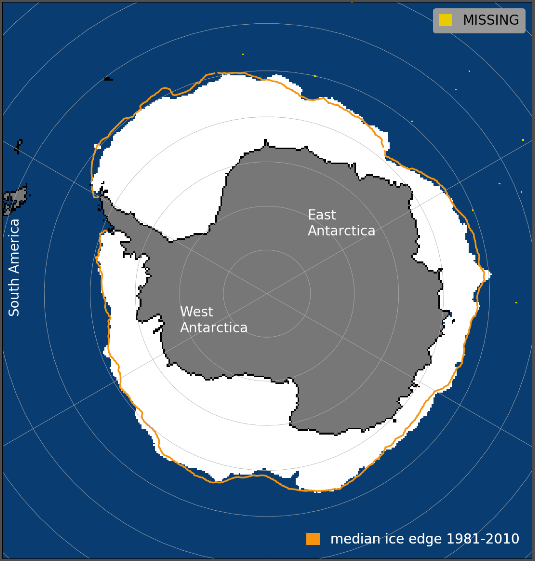
Figure 8. Antarctic sea ice extent on 13th June 2020, with 1981-2010 average extent indicated in orange, and the regions referred to in the text labelled. Underlying map and data courtesy of NSIDC.
References
Kalnay, E., and Coauthors, 1996: The NCEP/NCAR 40-Year Reanalysis Project. Bull. Amer. Meteor. Soc., 77, 437–472, https://doi.org/10.1175/1520-0477(1996)077<0437:TNYRP>2.0.CO;2.
Kurtz, N. and J. Harbeck. 2017: CryoSat-2 Level-4 Sea Ice Elevation, Freeboard, and Thickness, Version 1. Boulder, Colorado USA. NASA National Snow and Ice Data Center Distributed Active Archive Center. https://doi.org/10.5067/96JO0KIFDAS8. [accessed 11th June 2020].
Rayner, N. A.; Parker, D. E.; Horton, E. B.; Folland, C. K.; Alexander, L. V.; Rowell, D. P.; Kent, E. C. and Kaplan, A.: Global analyses of sea surface temperature, sea ice, and night marine air temperature since the late nineteenth century. J. Geophys. Res. Vol. 108, No. D14, 4407 doi:10.1029/2002JD002670, 2003.
Schreiber, E. A. P. and Serreze, M. C.: Impacts of synoptic-scale cyclones on Arctic sea ice concentration: a systematic analysis. Annals of Glaciology, 1–15. doi:10.1017/aog.2020.23, 2020
Schweiger, A., Lindsay, R., Zhang, J., Steele, M., Stern, H and Kwok, R.: Uncertainty of modelled arctic sea ice volume, J. Geophys. Res. (Oceans), 116, C8, doi:10.1029/2011JC007084, 2011