
Briefing on Arctic and Antarctic sea ice - August 2020
Alex West and Ed Blockley
Summary
- Arctic sea ice extent is currently joint-3rd lowest on record for the time of year (since satellite records began in 1979).
- Sea ice loss in the Arctic during July was the largest on record by a small margin. However, sea ice loss from 21st July – 10th August was very slow because the Arctic weather was cooler and stormier during this period
- The sea ice extent recorded in July 2020 was the lowest July extent on record following exceptionally fast ice loss during late June and much of July
- Extent is currently particularly low in the seas north of Siberia, driven by persistent warm winds from the south, and may have been assisted by high pressure over the Arctic Ocean during early July, allowing more sunlight to melt the ice
- September ice extent is likely to be low (very likely to be between the 11th and 2nd lowest extents recorded in the satellite era). Although a new record low now looks unlikely, some uncertainty remains due to the effect of Arctic weather during the remainder of August
- Antarctic sea ice extent is currently 13th lowest on record; as is normal, there are regions of both below- and above-average sea ice extent.
Current Arctic sea ice extent
Arctic sea ice extent on 9th August was 5.60 million square km, 1.87 million square km below the 1981-2010 average. This was the joint-3rd lowest extent for the date in the satellite record (since 1979), the lowest having been 5.10 million square km in 2012 (Figure 1).
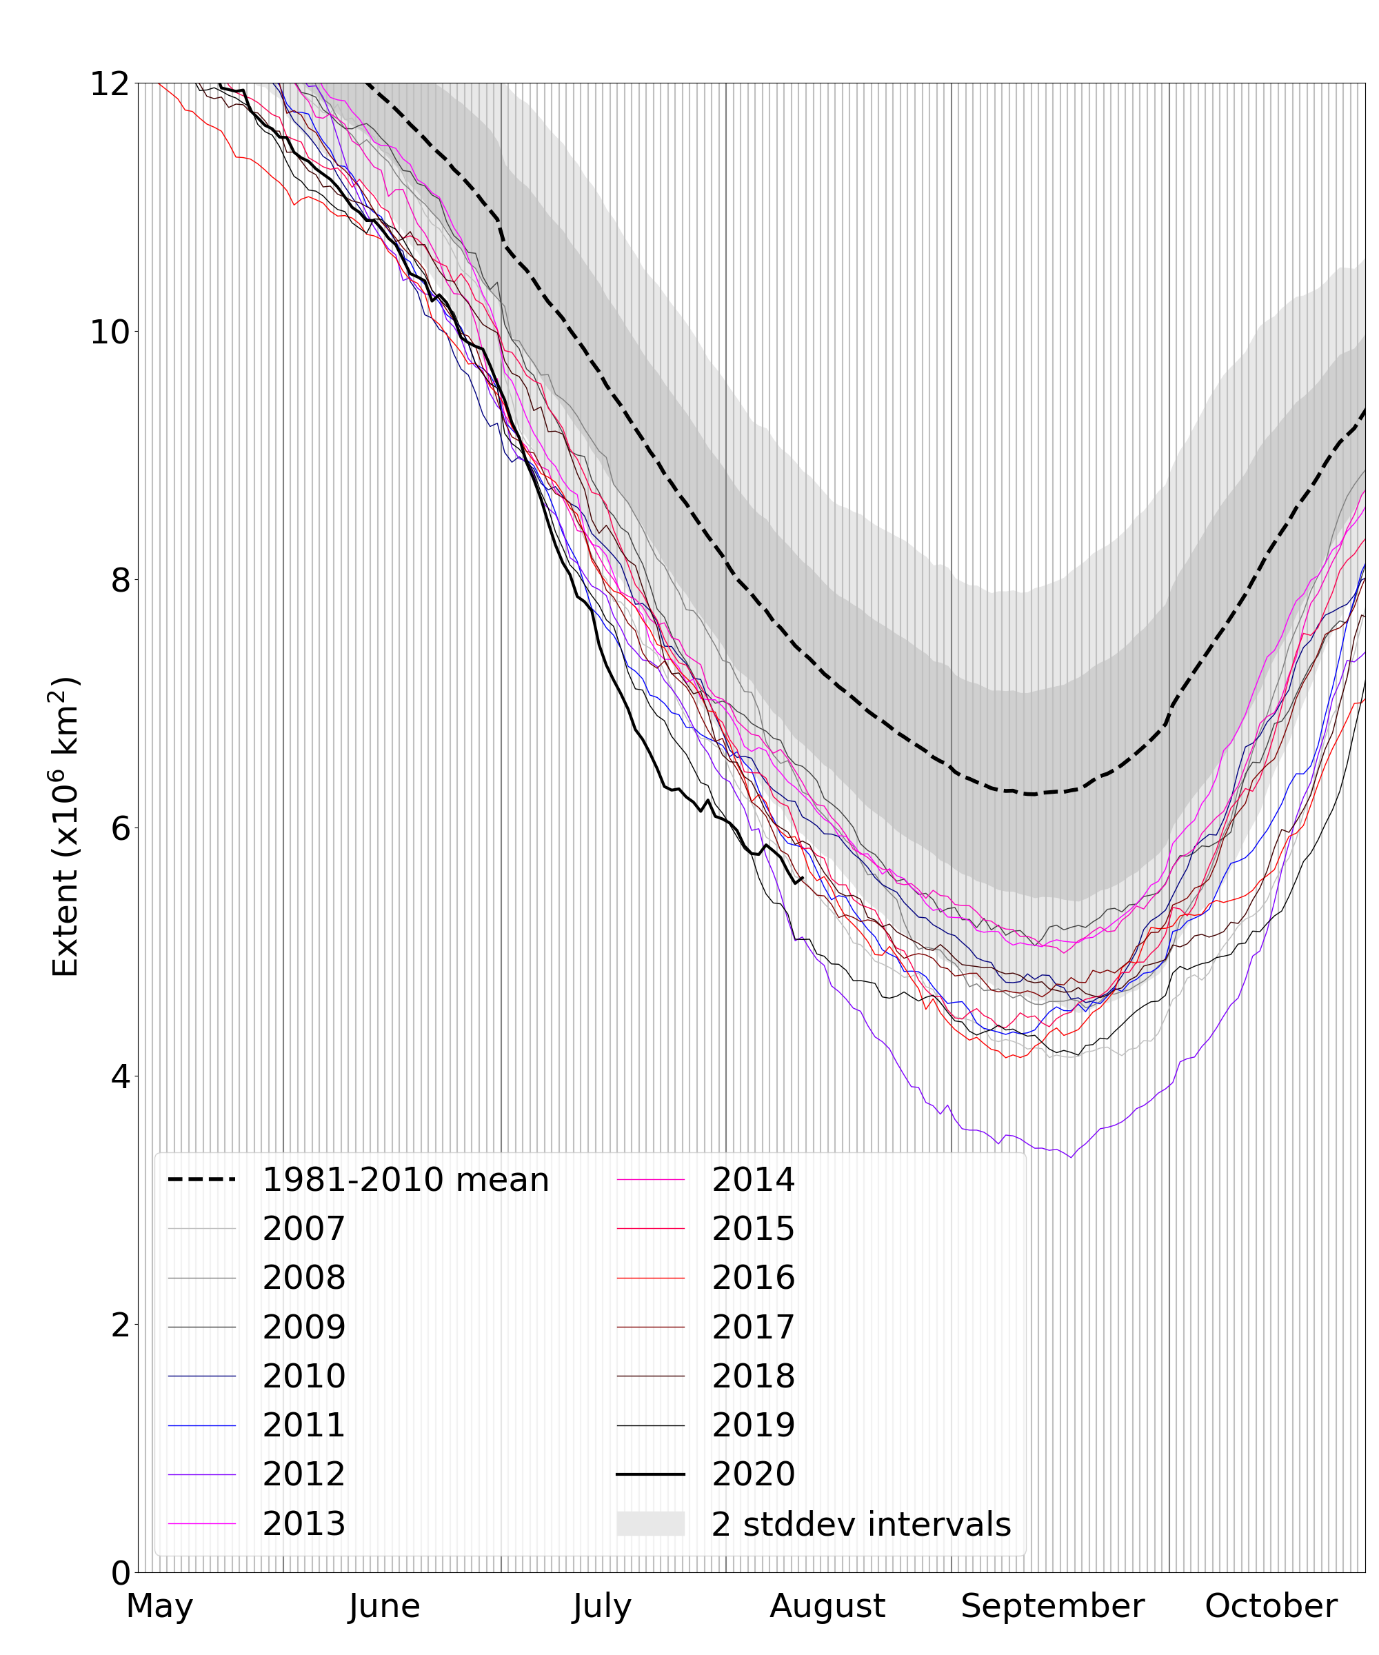
Figure 1. Daily Arctic sea ice extent for 2020, compared with recent years and the 1981-2010 average with ± 1 and 2 standard deviation intervals indicated by the shaded areas. Data are from the National Snow and Ice Data Center (NSIDC).
Extent was exceptionally low in all marginal seas north of Siberia (Barents, Kara, Laptev and East Siberian Seas), but was closer to average in the Beaufort and Chukchi Seas (Figure 2).
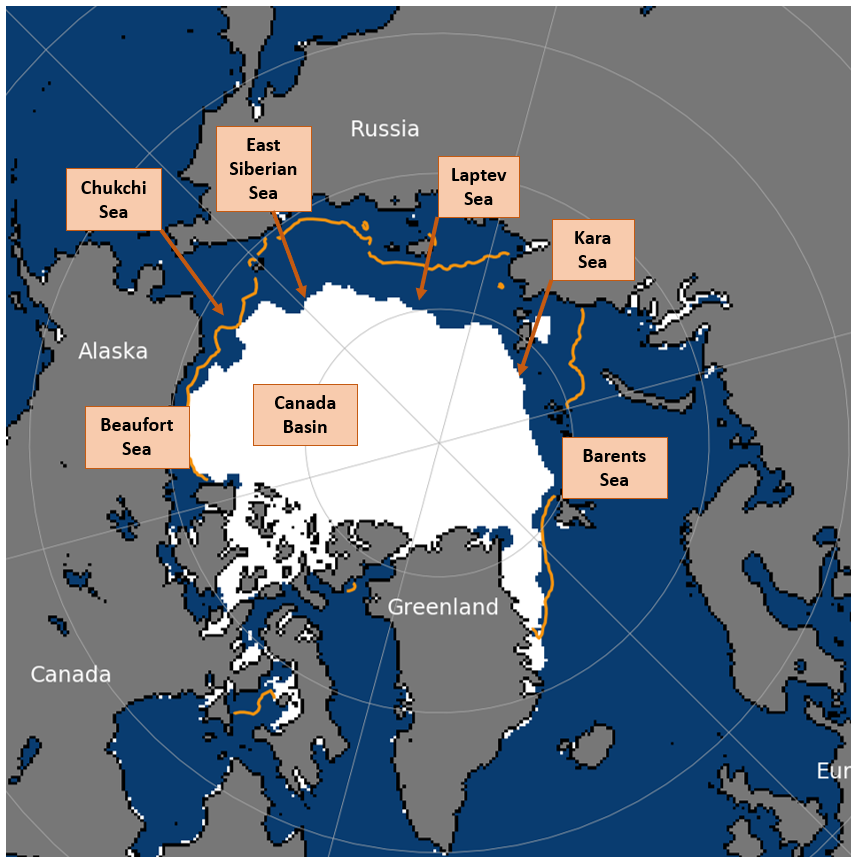
Figure 2. Arctic sea ice extent on 10th August 2020, with 1981-2010 average extent indicated in orange, and the regions referred to in the text labelled. Underlying map and data courtesy of NSIDC.
July 2020 in context
Arctic sea ice extent for July 2020 averaged 7.02 million square km (Figure 3). This was the lowest value in the satellite record, well below the next lowest, 7.44 million square km recorded in 2019. It was 2.44 million square km below the 1981-2010 average and 0.69 million square km below the long-term linear trend.
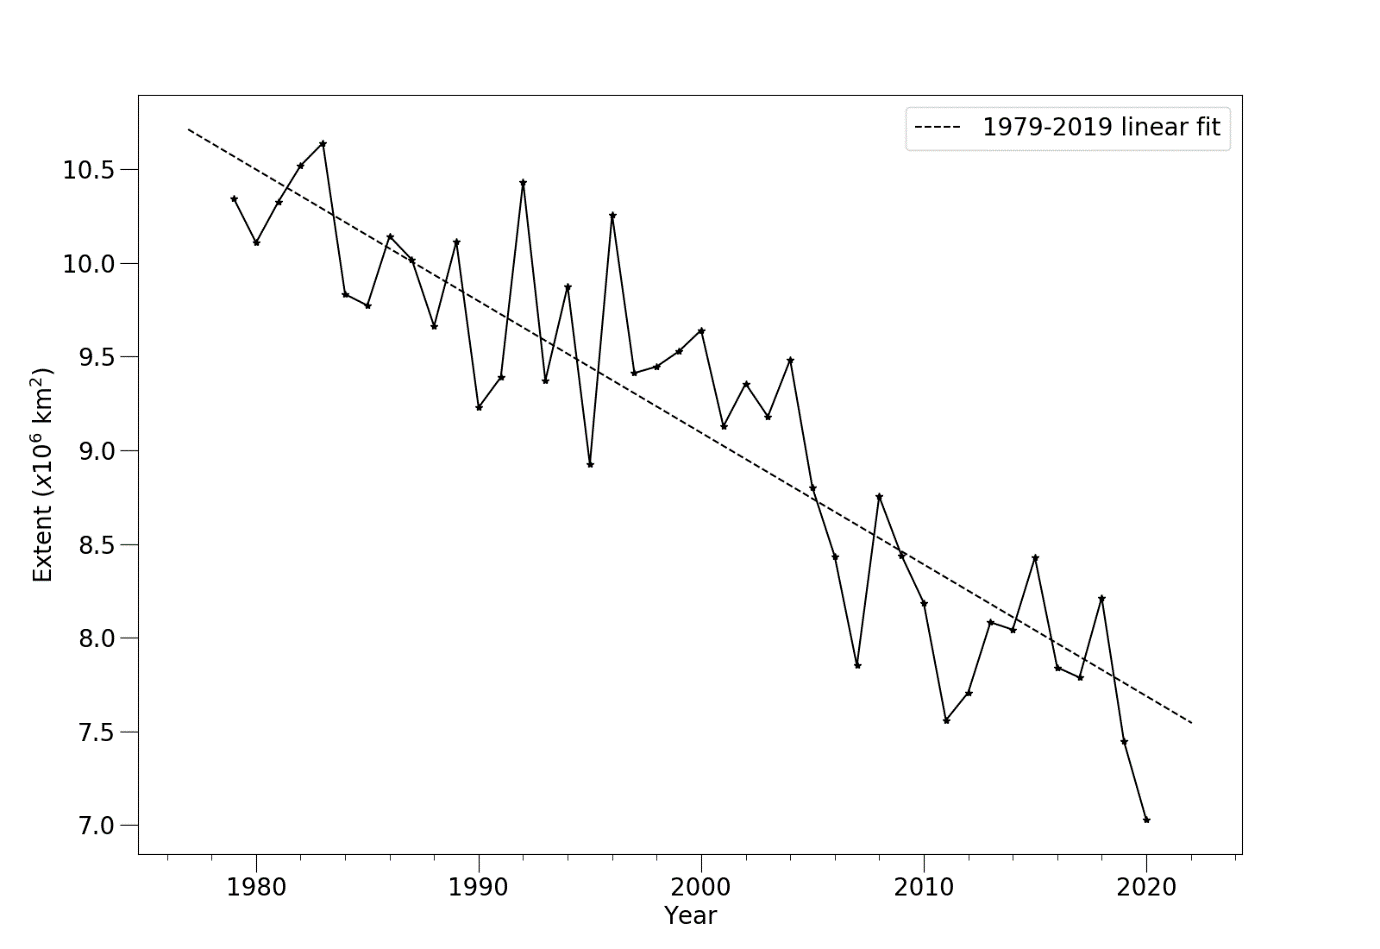
Figure 3. Average July Arctic sea ice extent according to the Hadley Centre Sea Ice and Sea Surface Temperature (HadISST) 1.2 dataset (Rayner et al., 2003).
Sea ice melt during the first half of July was exceptionally fast, continuing a period of fast ice loss that started in late June, largely focussed in the Laptev, and later the East Siberian, Sea. This was likely caused by prolonged warm southerly winds from Siberia associated with the notable Siberian heatwave (see also July briefing). In the first three weeks of July two more notable bursts of warm advection from Siberia took place, but melting may have been assisted by a powerful area of high pressure that sat over the central Arctic Ocean during that time (Figure 4a). This high pressure is likely to have increased the amount of sunlight melting the ice, as well as blocking the passage of cyclones, which are thought to be conducive to ice retention during summer (Screen et al., 2011; Schreiber and Serreze, 2020). Air temperatures at 925mb (a height of about 1km in the atmosphere) were also very high across the Arctic Ocean during the first three weeks of July (Figure 4b).
During the last ten days of July, ice loss slowed abruptly in response to changes in the weather. Around 21st July the high pressure rapidly broke down, and low-pressure systems moving north from Western Siberia and Alaska began to dominate the Arctic Ocean weather (Figure 4c). From 27th-29th July an unusually intense summer cyclone developed in the Beaufort Sea, reaching a minimum central pressure of 975 hPa on 28th July. The cyclone is likely to have contributed to the reduced loss in ice extent by spreading out the existing ice over a wider area. However, melting itself may also have slowed, as upper air temperatures from 21st-31st July were closer to average than from 1st – 20th, particularly over the Beaufort Sea and Canada Basin (Figure 4d).
The weather across much of the Arctic Ocean has remained cyclonic and cool throughout early August, and from 10th August, the rate of ice loss remained very slow. The variation in ice melting rate in 2020 has been highly unusual; from 26th June – 17th July, the total ice loss of 2.93 million square km was the highest 3-week loss on record; from 20th July – 10th August, the total ice loss of 1.01 million square km was the lowest on record for this time of year. Despite this variation, the overall average daily rate of ice loss during July 2020 of 108,000 square km per day was the highest on record at, albeit only slightly higher than in in 2019 and 2018 (107k and 106k square km per day respectively).
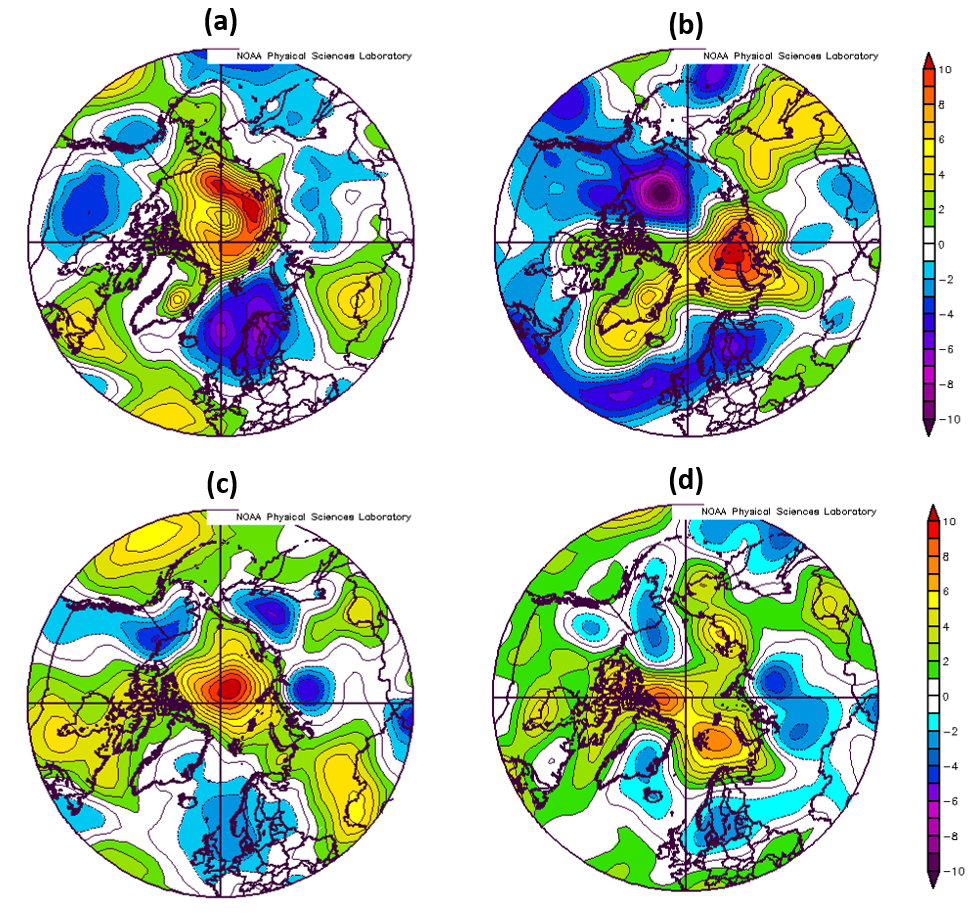
Figure 4. (a-b) Mean sea level pressure anomaly, (c-d) air temperature anomaly at 925mb for 1st-20th July and 21st – 31st July respectively, relative to the 1981-2010 average. Data are from the NCEP reanalysis (Kalnay et al, 1996).
Outlook for September
It is now very likely that 2020 will see another notably low September sea ice extent, and quite likely that 2020 will be one of the lowest 4 September extents on record. Although still a possibility, a new record low is unlikely this year. However, there is still considerable uncertainty in the predictions as the weather during August will have a strong impact on the eventual extent of melting.
The above summary is based on evidence from a variety of predictions, described below and shown in Figure 5:
- The Sea Ice Prediction Network (SIPN) collates predictions of September sea ice extent from scientific centres around the world in three reports published in June, July and August. The median prediction in the July report is 4.36 million square km, with an interquartile range of 4.1 to 4.6 million square km. This is a very similar range of predictions to that seen in the June report. Only two of the 33 predictions predict a new record low September sea ice extent.
- A statistical prediction based on extrapolating the long-term trend gives a September extent of 4.27 ± 1.06 million square km.
- There is a reasonable correlation between average September sea ice extent and sea ice extent from 27th July – 10th August (the most recent 15 days of data at the time of writing). Applying simple statistical methods to the anomalies for these dates gives a September mean extent of 3.98 ± 0.55 million square km.
- Finally, applying the trajectories of melting observed over August and September of each year in the 1979-2019 satellite record to the current Arctic sea ice extent provides an estimate of the September sea ice extents that are still possible this year, ranging from 3.85 to 4.95 million square km. A sea ice extent of 3.85 million square km would represent the 2nd lowest September extent on record (after 2012), whilst 4.95 million square kmwould represent the 11th lowest.
Figure 5. September median Arctic sea ice extent since satellite records began in 1979 from the HadISST1.2 dataset (Rayner et al., 2003), with SIPN Sea Ice Outlook and statistical predictions for September 2019. For the statistical predictions, error bars represent twice the standard deviation of September mean ice extent about the trend lines with respect to which the estimates are taken. The Sea Ice Outlook is shown as a boxplot indicating range, median and quartiles of the 33 predictions submitted. The distribution obtained from applying 2007-2019 melt trajectories to the current extent is shown similarly. Values more than 1.5 interquartile ranges from the first and third quartiles are shown as outliers.
Antarctic sea ice state
Antarctic sea ice extent on 10th August 2020 was 17.36 million square km, 0.16 million square km below the 1981-2010 average. This was the 13th lowest extent for this date in the satellite record, the lowest having been 16.54 in 1986 (Figure 6).
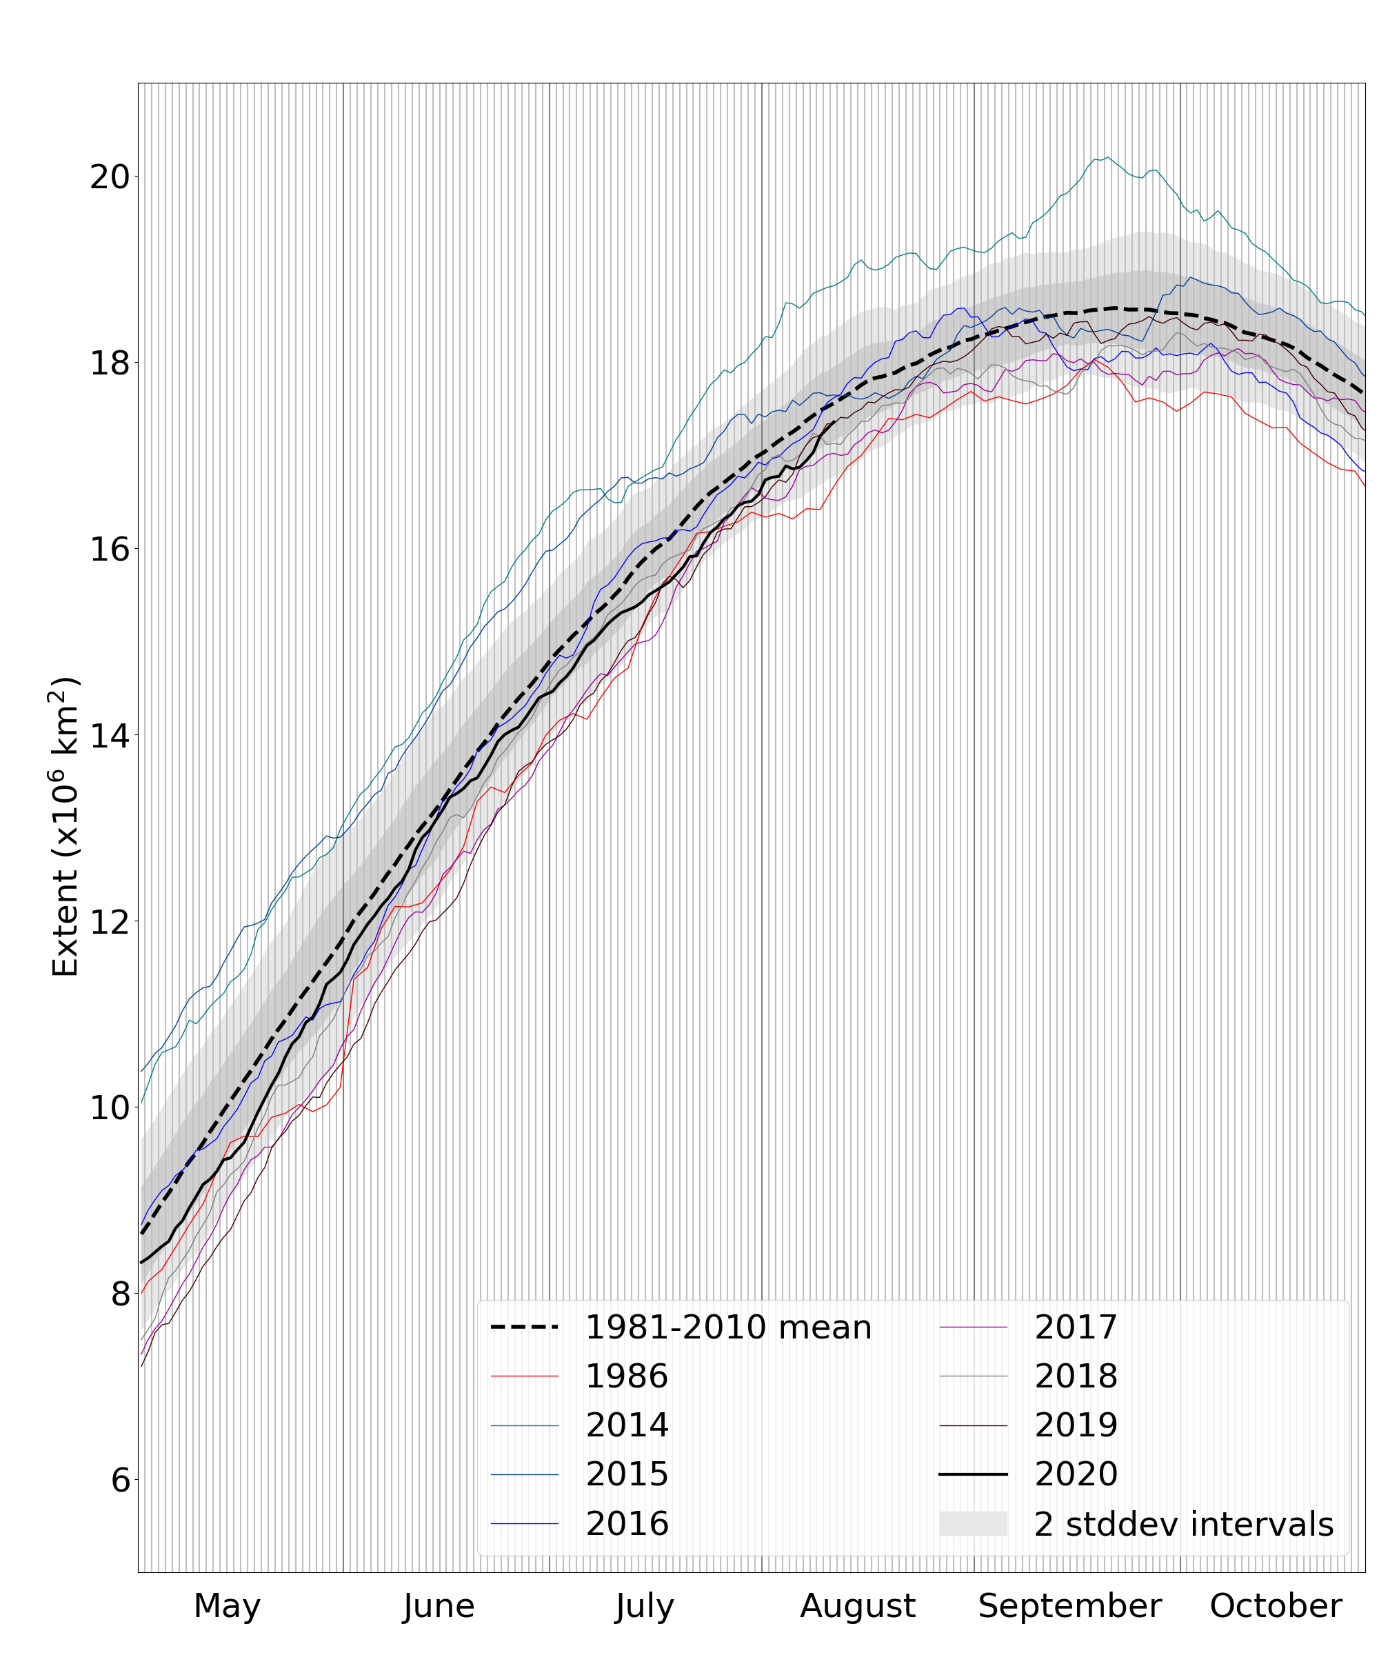
Figure 6. Daily Antarctic sea ice extent for 2020, compared with recent years, the low ice year of 1986, and the 1981-2010 average, with ± 1 and 2 standard deviation intervals indicated by the shaded areas. Data are from NSIDC.
Extent was lower than average in the Bellingshausen and Ross Seas, but higher than average in, and to the east of, the Weddell Sea (Figure 7).
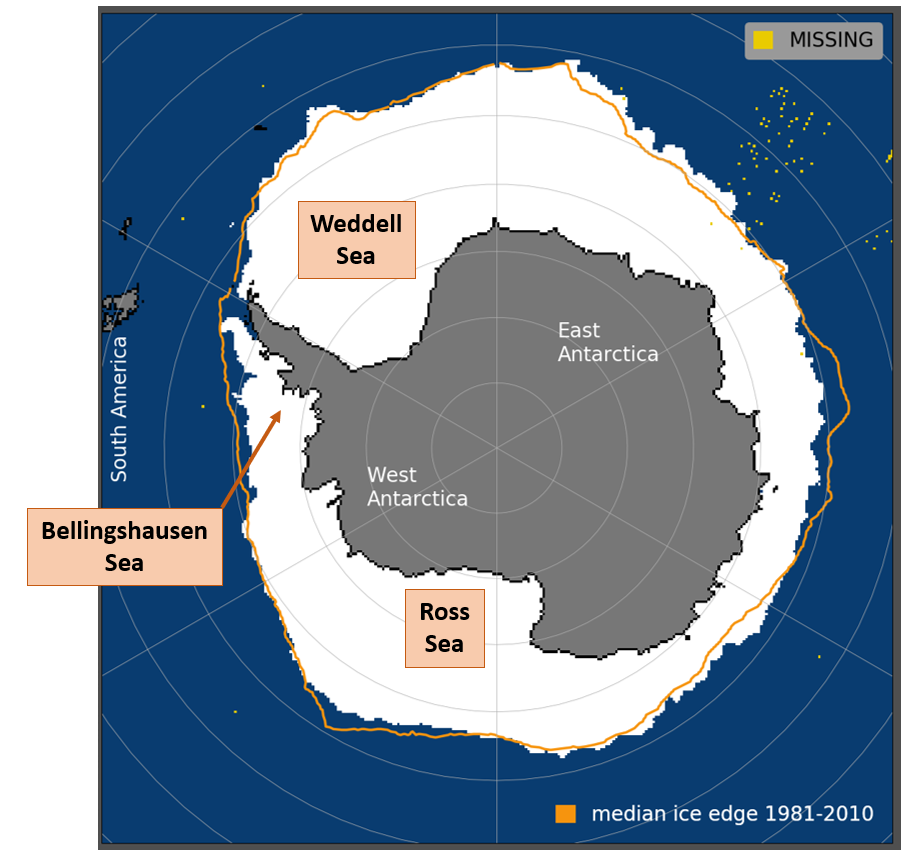
Figure 7. Antarctic sea ice extent on 10th August 2020, with 1981-2010 average extent indicated in orange, and regions referred to in the text labelled. Underlying map and data courtesy of NSIDC.
References
Kalnay, E., and Coauthors, 1996: The NCEP/NCAR 40-Year Reanalysis Project. Bull. Amer. Meteor. Soc., 77, 437–472, https://doi.org/10.1175/1520-0477(1996)077<0437:TNYRP>2.0.CO;2.
Rayner, N. A.; Parker, D. E.; Horton, E. B.; Folland, C. K.; Alexander, L. V.; Rowell, D. P.; Kent, E. C. and Kaplan, A.: Global analyses of sea surface temperature, sea ice, and night marine air temperature since the late nineteenth century. J. Geophys. Res. Vol. 108, No. D14, 4407 doi:10.1029/2002JD002670, 2003.
Screen, J. A., Simmonds, I. and Keay, K: Dramatic interannual changes in perennial Arctic sea ice linked to abnormal summer storm activity. J. Geophys Res., Vol. 116, No. D15, doi: 10.1029/2011JD015847, 2011.
Schreiber, E. A. P. and Serreze, M. C.: Impacts of synoptic-scale cyclones on Arctic sea ice concentration: a systematic analysis. Annals of Glaciology, 1–15. doi:10.1017/aog.2020.23, 2020