
Briefing on Arctic and Antarctic sea ice - July 2021
Alex West and Ed Blockley
Summary
- Arctic sea ice extent on 11th July was the second-lowest on record for this date, following a brief period of very rapid ice loss from 30th June – 4th July.
- Extent was particularly low in the seas north of Siberia.
- The rapid ice loss of 30th June – 4th July was mainly caused by a heatwave in East Siberia, part of a pattern of blocked weather in the Northern Hemisphere that has also caused the recent Western North America heatwave.
- June Arctic sea ice extent was the 7th lowest on record, with an above-average rate of ice loss; the month was stormy over the Arctic, with the warmest temperature anomalies in the eastern Siberian seas.
- September 2021 is likely to see another notably low Arctic sea ice extent (among the 15 lowest), but uncertainty remains very high at this point in the season. In particular, it is not possible to say at this stage whether there is a heightened chance of a record low extent.
- Antarctic sea ice extent on 11th July was moderately above average (13th highest on record). Regions with notably high extent included the Ross Sea and the western Bellingshausen Sea.
Current Arctic sea ice extent
Arctic sea ice extent on 11th July 2021 was 7.98 million sq km (Figure 1). This was the 2nd lowest extent recorded for this date in the era of satellite observations (since 1979). The lowest extent was the 7.85 million sq km recorded in 2020. Extent on 11th July 2021 was 1.95 million sq km below the 1981-2010 average. The near record-low extent follows a short period of very rapid ice loss, with 1.00 million sq km lost from 30th June – 4th July. This resulted in ice extent briefly becoming the lowest on record by a wide margin. However, since 4th July melting has slowed somewhat.
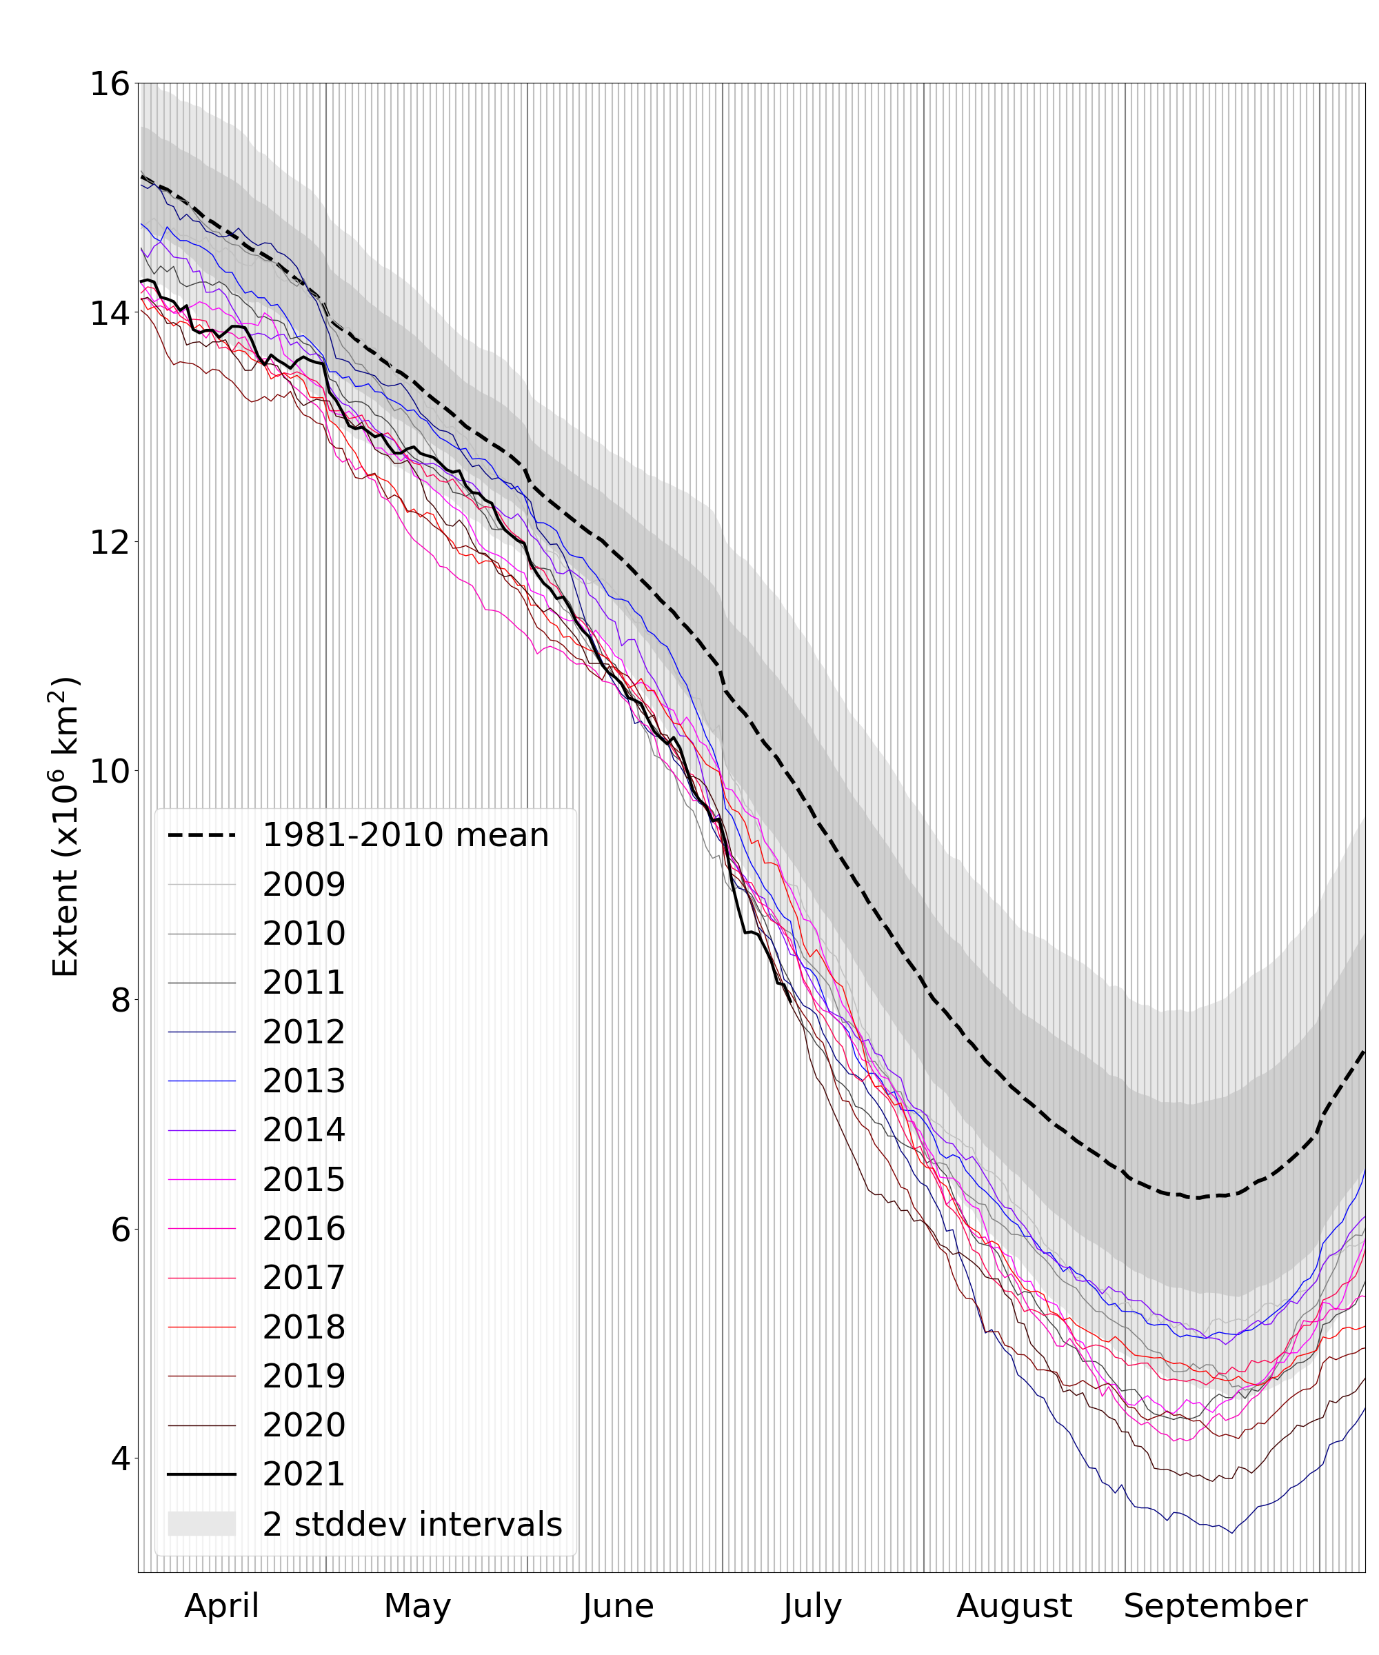
Figure 1. Daily Arctic sea ice extent for 2021, compared with recent years and the 1981-2010 average with ± 1 and 2 standard deviation intervals indicated by the shaded areas. Data are from the National Snow and Ice Data Center (NSIDC).
Extent was well below average in all seas north of Siberia (Kara, Laptev and East Siberian Seas) but was nearer average in the Beaufort and Chukchi Seas north of Alaska and Canada (Figure 2).
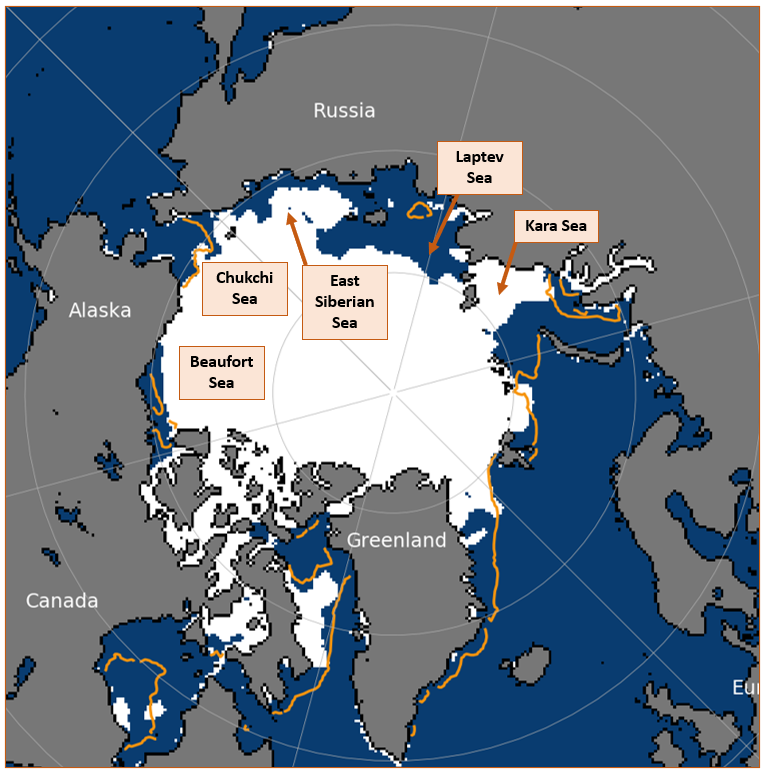
Figure 2. Arctic sea ice extent on 11th July 2021, with 1981-2010 average extent indicated in orange, and the regions referred to in the text labelled. Underlying map and data courtesy of NSIDC.
June 2021 in context
The average sea ice extent for June 2021 was 10.86 million sq km according to the HadISST1.2 dataset (Figure 3; Rayner et al, 2003). This was 1.01 million sq km below the 1981-2010 average and 0.05 million sq km above the long-term linear trend. Although 2021 was the 7th lowest June sea ice extent on record, it was very similar to (within 0.10 million sq km of) the 2nd to 6th lowest June extents (2012, 2020, 2018, 2019 and 2010 respectively). Only the June extent of 2016 was considerably lower at 10.58 million sq km.
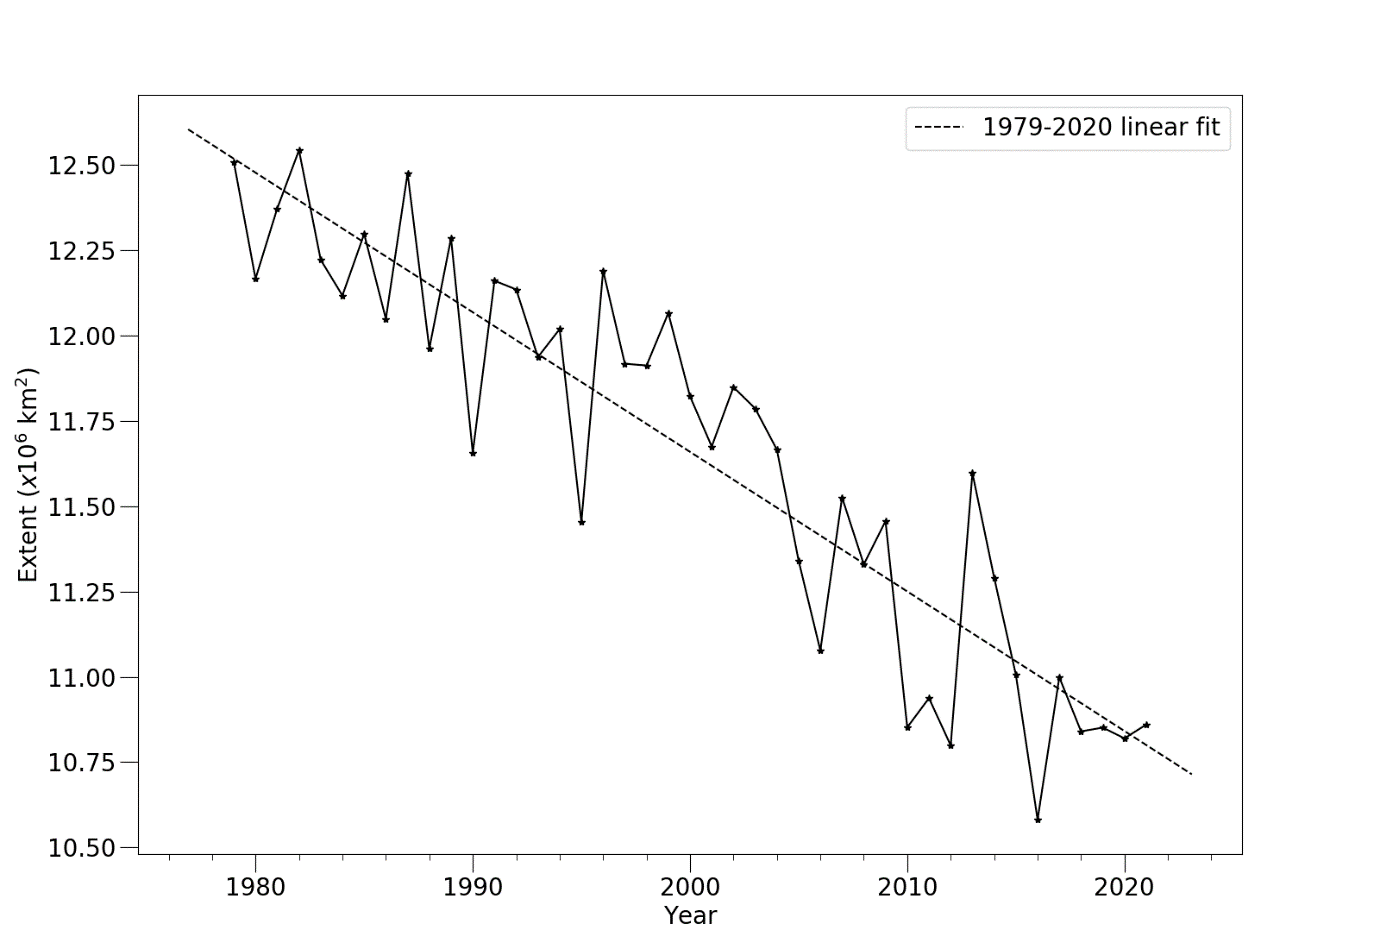
Figure 3. Average June Arctic sea ice extent according to the Hadley Centre Sea Ice and Sea Surface Temperature (HadISST) 1.2 dataset (Rayner et al., 2003).
The average rate of sea ice loss during June 2021 was 81,000 sq km per day. This was the 8th fastest rate of loss on record and was 22,000 sq km per day faster than the 1981-2010 average.
June was a persistently unsettled, stormy month over the Arctic Ocean (Figure 4a), but a ridge of high pressure over Eastern Siberia often caused warm southerly winds in the Laptev and East Siberian Seas. Temperatures ranged from near-average in the Beaufort and Kara Seas to over 3°C above average in the Laptev and East Siberian Seas (Figure 4b). The period 1st – 5th July saw yet another outbreak of warm air in this region, associated with further rapid melting of ice in these seas. This contributed to the exceptional Arctic-wide loss noted above. This was also part of a pattern of blocked weather in the Northern Hemisphere during late June and early July. A near-stationary jet stream displayed northward shifts, with associated heatwave conditions, over Eastern Siberia, Western North America and Eastern Europe / Western Russia. However only the East Siberian heatwave was directly implicated in the rapid sea ice loss in the Arctic Ocean.
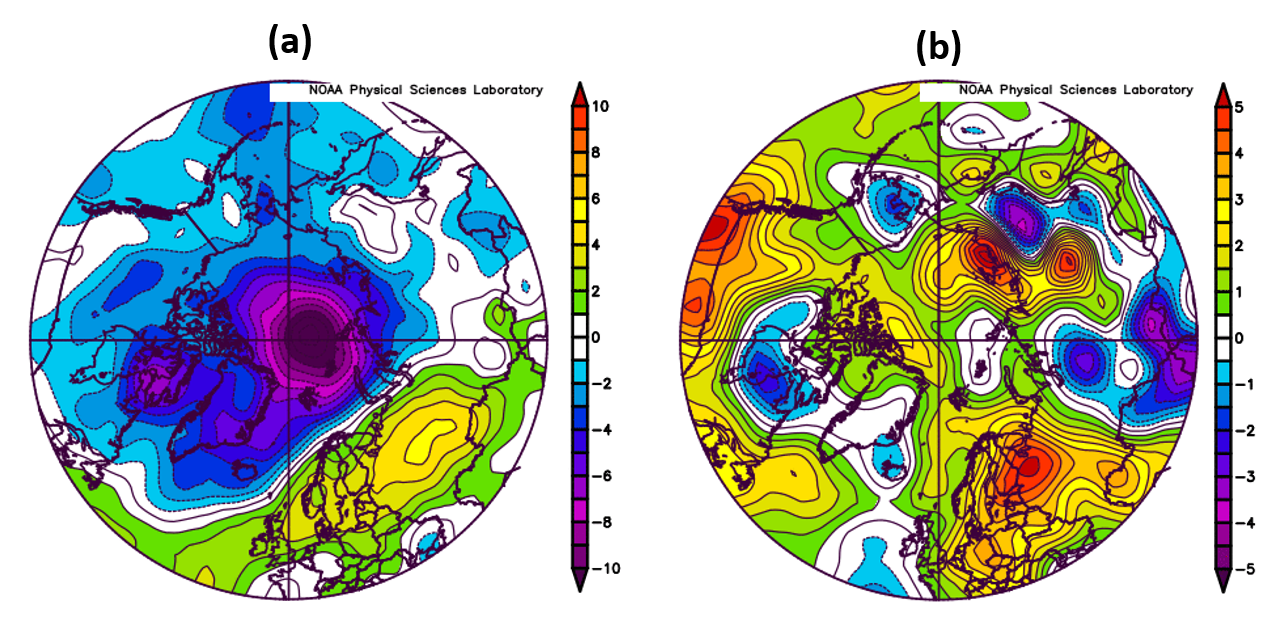
Figure 4. (a) Mean sea level pressure anomaly (hPa); (b) air temperature anomaly (°C) at 925 hPa, for June 2021. Anomalies are relative to the 1981-2010 average. Data are from the NCEP reanalysis (Kalnay et al., 1996).
Outlook for September
There is currently no indication of a heightened likelihood of a new record low September sea ice extent occurring this year. However, present indications are that this year will see another notably low September sea ice extent, among the 15 lowest on record, and a record low remains possible at this stage.
The Sea Ice Outlook (SIO), coordinated by the Sea Ice Prediction Network (SIPN), comprises 38 predictions of 2021 September Arctic sea ice extent from scientific centres around the world. These range from 3.73 to 5.23 million sq km (equivalent to 2nd and 15th lowest respectively), with a median estimate of 4.37 million sq km and an interquartile range of 4.07 to 4.61 million sq km (Figure 5). None of the SIO predictions would represent a new record low extent. However, the uncertainty ranges of many estimates encompass a new record low.
To complement the SIO estimates, two predictions of September sea ice extent are made using basic statistical methods (also shown on Figure 5):
- A prediction based on extrapolating the long-term linear trend gives a September sea ice extent of 4.15 ± 1.05 million sq km, indicated in black on Figure 5.
- There is a reasonable correlation between mean September ice extent and the extent for 27th June – 11th July (the most recent 15 days of data available at the time of writing). Applying simple statistical methods to the anomalies for these dates gives a prediction of September mean extent of 4.16 ± 0.80 million sq km, indicated in blue on Figure 5.
These uncertainty intervals encompass September extents that range from 1st to 15th lowest, and 1st to 12th lowest, respectively. This, together with the wide range of SIO predictions, indicates that uncertainty remains very high at this point in the season.
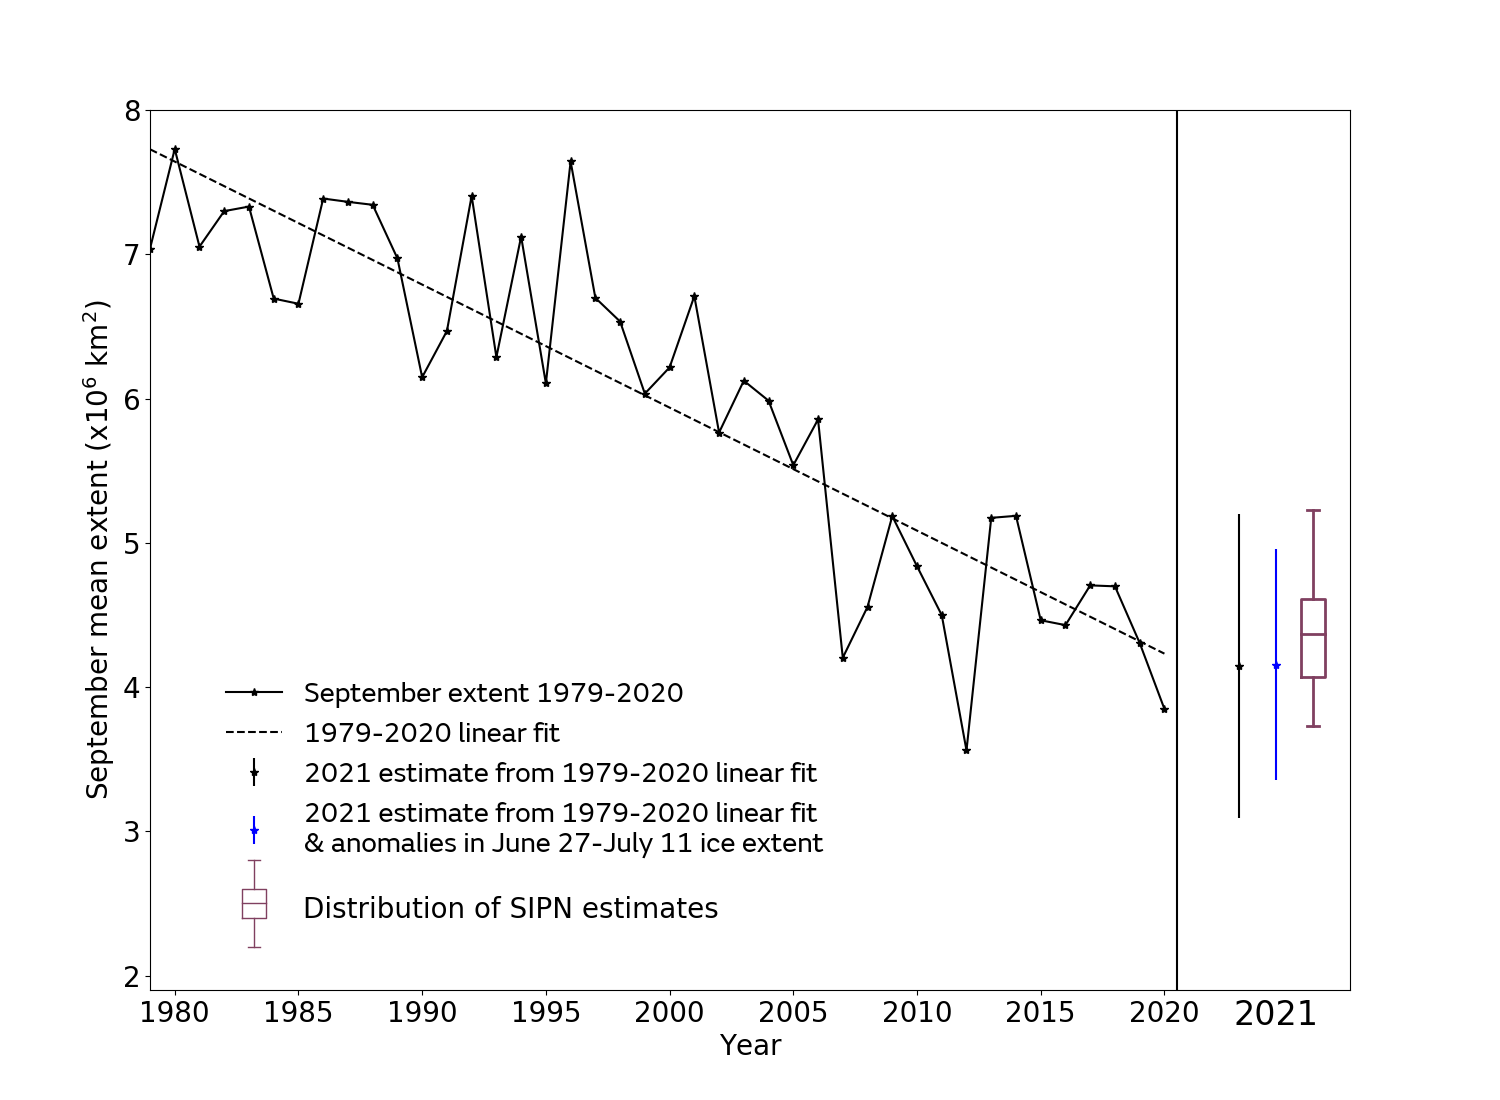
Figure 5. September median Arctic sea ice extent since satellite records began in 1979 from the HadISST1.2 dataset (Rayner et al., 2003), with SIPN Sea Ice Outlook and statistical predictions for September 2021. For the statistical predictions, error bars represent twice the standard deviation of September mean ice extent about the trend lines with respect to which the estimates are taken. The Sea Ice Outlook is shown as a boxplot indicating range, median and quartiles of the 38 predictions submitted.
Current Antarctic sea ice extent
Antarctic sea ice extent on 11th July 2021 was 15.82 million sq km (Figure 6). This was 0.25 million sq km above the 1981-2010 average, and the 13th highest extent recorded for this date in the satellite era. As usual there was regional variation in the anomaly; areas of higher-than average extent included the western Indian Ocean sector, the Ross Sea and the western Bellingshausen Sea (Figure 7), but extent was lower than average in the vicinity of the Antarctic Peninsula and in the Weddell Sea.
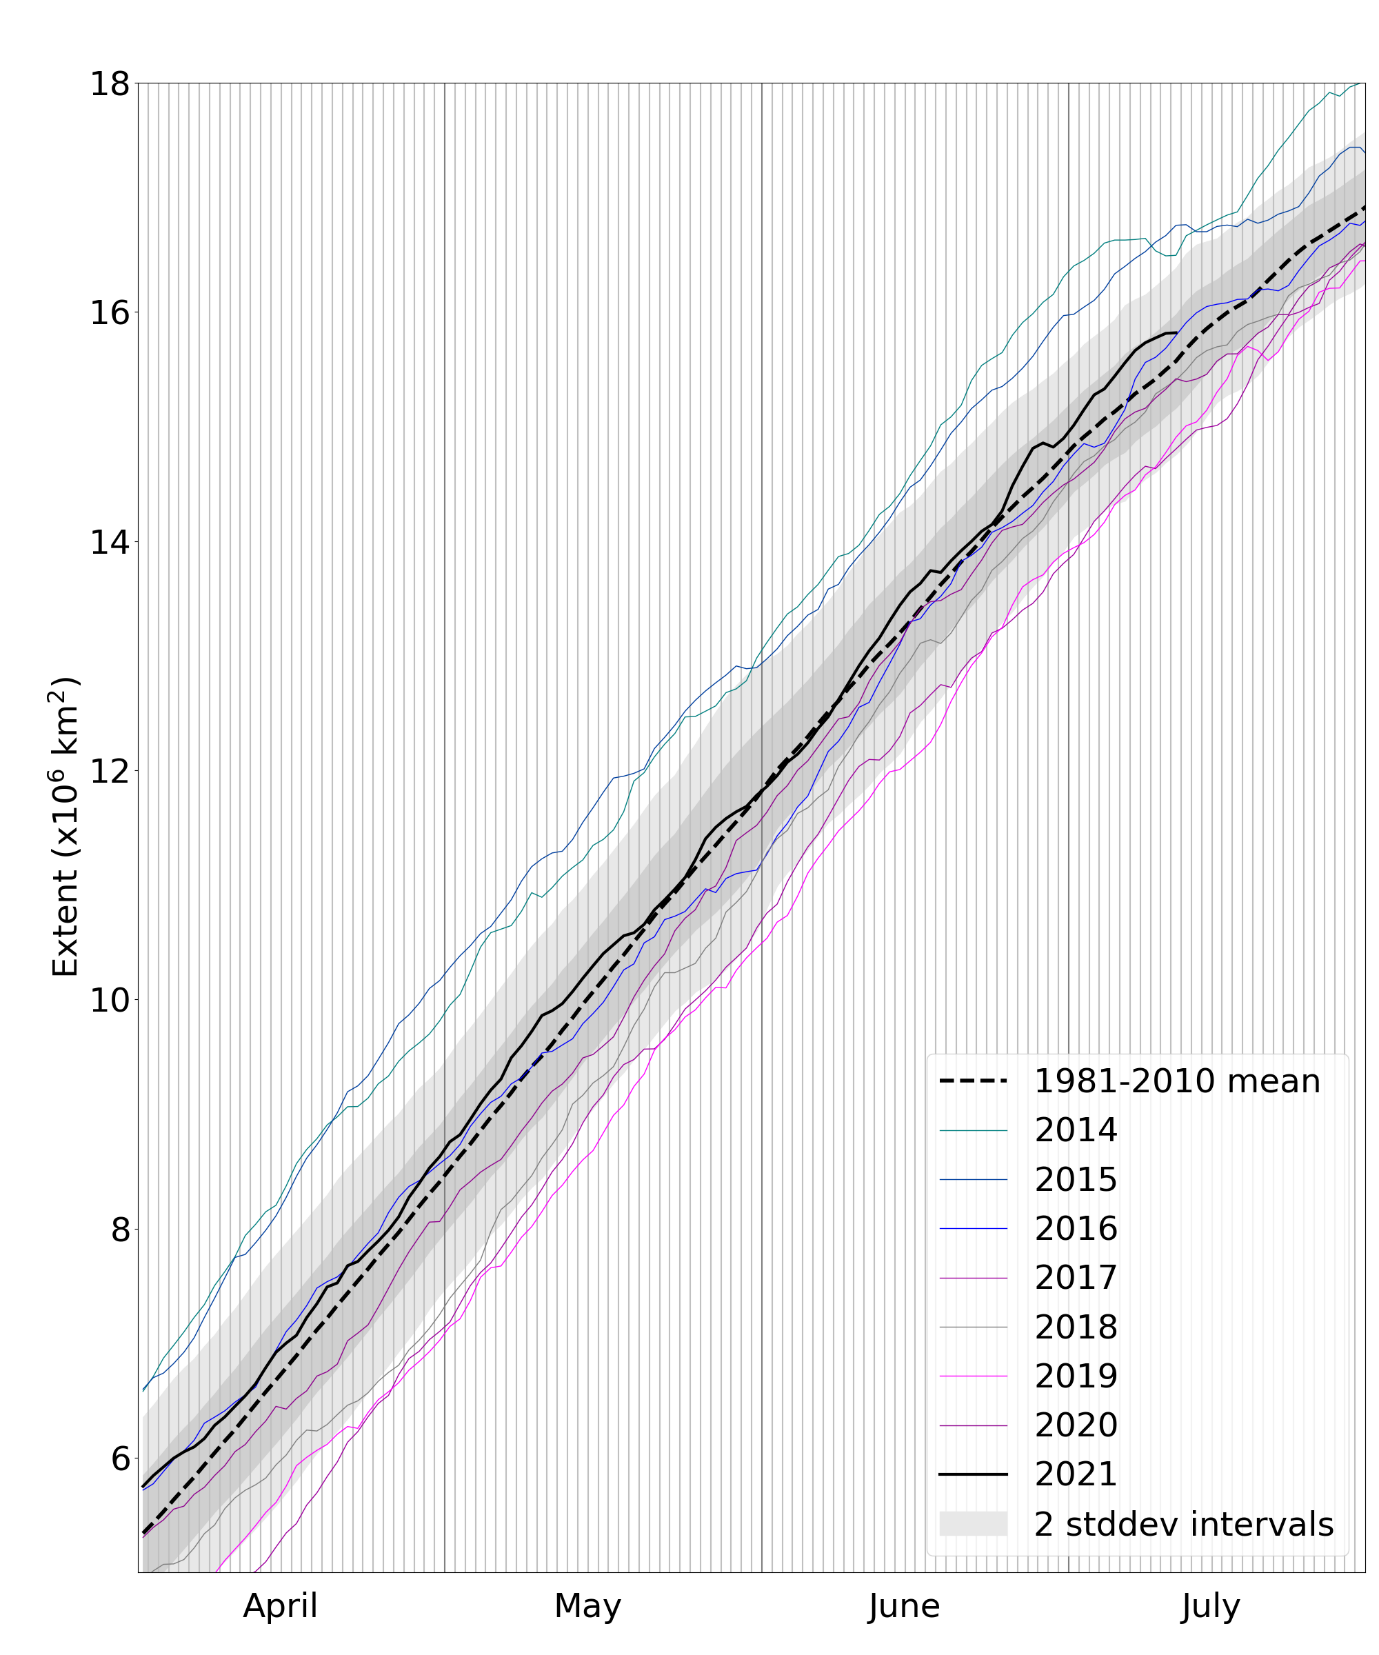
Figure 6. Daily Antarctic sea ice extent for 2021, compared with recent years and the 1981-2010 average, with ± 1 and 2 standard deviation intervals indicated by the shaded areas. Data are from NSIDC.
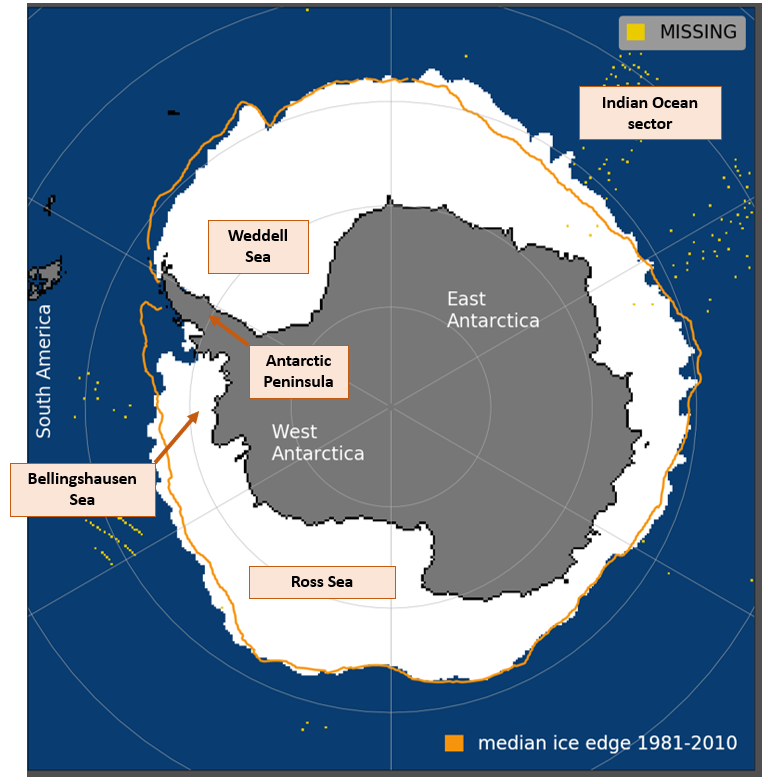
Figure 7. Antarctic sea ice extent on 11th July 2021, with 1981-2010 average extent indicated in orange, and regions referred to in the text labelled. Underlying map and data courtesy of NSIDC.
References
Kalnay, E., and Coauthors: The NCEP/NCAR 40-Year Reanalysis Project. Bull. Amer. Meteor. Soc., 77, 437–472, https://doi.org/10.1175/1520-0477(1996)077<0437:TNYRP>2.0.CO;2, 1996.
Rayner, N. A.; Parker, D. E.; Horton, E. B.; Folland, C. K.; Alexander, L. V.; Rowell, D. P.; Kent, E. C. and Kaplan, A.: Global analyses of sea surface temperature, sea ice, and night marine air temperature since the late nineteenth century. J. Geophys. Res., Vol. 108, No. D14, 4407, https://doi.org/10.1029/2002JD002670, 2003.