Mauna Loa carbon dioxide forecast for 2017
Forecast of the annual rise in atmospheric carbon dioxide concentration measured at the Mauna Loa, Hawaii
The Met Office forecast of the annual rise in atmospheric carbon dioxide at Mauna Loa issued in 2016 suggests that the 2017 rise will be smaller than that in 2016, but still larger than the previous average.
The annual mean CO2 concentration at Mauna Loa in 2017 is forecast to be 406.75 ± 0.61 ppm, which is 2.46 ± 0.61 ppm higher than 2016. This rise is smaller than the rise of 3.39ppm measured between 2015 and 2016, but larger than the average rise of approximately 2.1ppm over the previous decade.
The 2015-2016 CO2 rise was the largest in the 50-year Mauna Loa record. It was forecast to be 3.15 ± 0.53 ppm, on the basis of ongoing anthropogenic emissions and the temporary effect of the 2015-16 El Niño event in weakening tropical land carbon sinks. The 2016 annual mean CO2 was forecast to be 404.45 ± 0.53 ppm, which compares with the measured 2016 mean concentration of 404.28 ppm. That successful forecast was a collaboration between the Met Office and the Scripps Institution of Oceanography.
Atmospheric CO2 concentrations are rising year-on-year due to emissions from burning fossil fuels and deforestation. The annual rise temporarily becomes faster during El Niño events, due to reduced tropical land carbon uptake resulting from warm, dry conditions. Since El Niño conditions had ended by mid-2016, the land carbon sink is expected to have currently returned to its usual magnitude. However, carbon sinks only offset approximately 50% of anthropogenic emissions, so atmospheric CO2 still continues to rise annually.
There is also a seasonal cycle in atmospheric CO2 due to uptake by ecosystems in the northern hemisphere summer, and release in winter. In 2017, the maximum monthly value is forecast to be 409.86 ± 0.61 ppm in May, and the minimum monthly value 403.72 ± 0.61 ppm in September (Figure 1).
2016 was correctly forecast as the first year in which the September minimum CO2 would remain above 400ppm, making 2016 the first year in the Mauna Loa record with CO2 above 400ppm all year round.
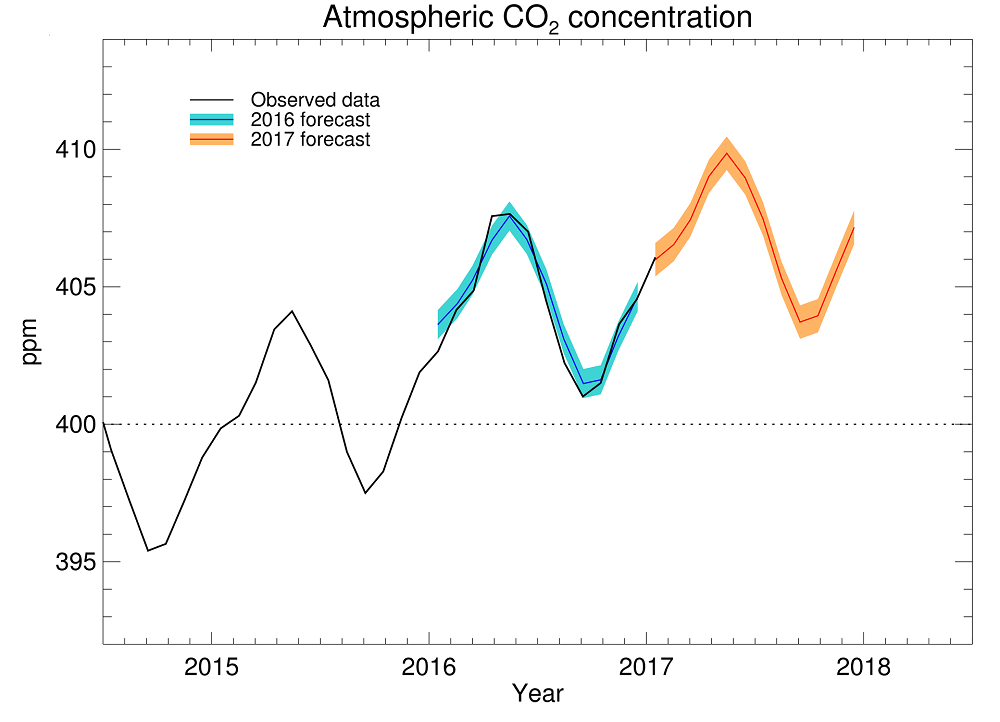
Figure 1. Observed and forecast CO2 concentrations.
The annual CO2 rise forecast is based on observed emissions of CO2 from human sources, along with a statistical relationship with observed and forecast sea surface temperatures in the equatorial Pacific Ocean – these are a commonly-used metric of the magnitude of El Niño / Southern Oscillation (ENSO) events and correlate with variability in the rate of rise of CO2.
A key part of the 2016 forecast was the inclusion of the role of El Niño. A simple extrapolation of the previous trend of 2.1ppm/year would have underestimated the annual CO2 concentration as being 402.9 – 403.1 ppm, with the September minimum incorrectly expected to be below 400 ppm (Figure 2). It has been proposed that an apparent steadying of the rate of rise from 2002-2014 was due to the temporary slowdown in global mean surface temperature increase, and that without this, the annual rate of rise would have been expected to increase. Nevertheless, the annual rate of rise would still not be expected to have exceeded 3 ppm without the El Niño.
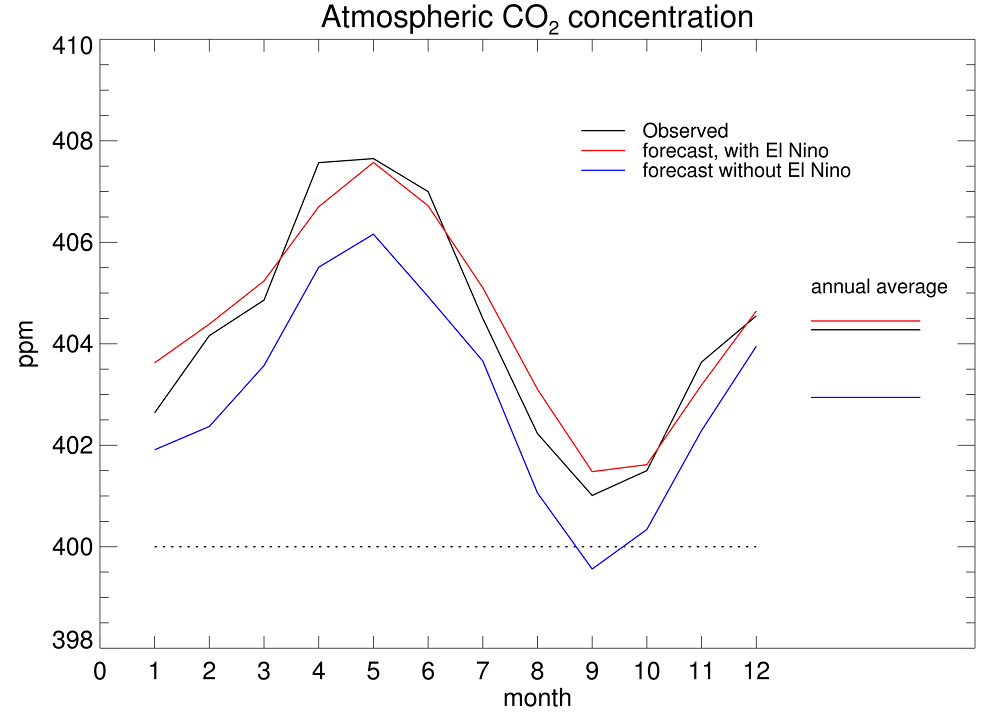 Figure 2. Comparing observed CO2 concentrations at Mauna Loa with those forecast considering the effects of El Niño (red) and ignoring El Niño (blue).
The additional effect of the El Niño meant that the rise in CO2 concentration in 2016 was larger than previous years despite the fact that global emissions had increased much more slowly. It was also larger than the rise following the previous major El Niño event in 1997/98, even though the 2015/16 El Nino was not larger than the 1997/98 event. This is because human emissions have increased by approximately 20% since then.