Attributing extreme weather to climate change
This page explains how we study extreme weather events, to see if climate change was a cause. These attribution studies help shape our understanding of climate change and its impacts.
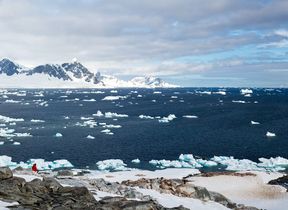
Extreme weather events, such as heatwaves and floods, impact all levels of society. These events can lead to large economic costs, population displacement, and loss of life.
Many factors can contribute to extreme weather events. Some of these are natural, but we can link others to climate change, driven by human activity.
How do we link extreme weather to climate change?
An attribution study aims to answer the question, “Did climate change cause this?”
Scientists can look at specific weather events and see if climate change was a factor.
To do this, they start with a clear, scientific question in mind. For example, the question might relate to the severity or frequency of a weather event:
- How much more intense is the extreme weather event because of climate change?
- How much more common is the extreme weather event because of climate change?
How long does a climate change attribution study take?
Attribution studies can be lengthy because they rely on so much information. It takes time to:
- collect observations
- run computer models to simulate the Earth’s climate
- analyse the results.
Thanks to new scientific advances, though, they are a lot faster. Today, we can sometimes complete attribution studies in the weeks after an event, rather than years.
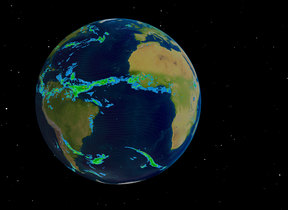
What information do we use in a climate change attribution study?
Lots of information goes into the simulation behind attribution studies. This includes:
- Natural climate variability
- Weather patterns
- Concentration of aerosols
- Greenhouse gas emissions
- Sea surface temperature
- Topography
- Observations
It’s important to understand these factors and how they influence a weather event. For example, natural climate variability and weather patterns are natural influences. Aerosols and greenhouse gases, though, are more affected by human action. The sea surface temperature can play a role, as can the local topography where the event took place.
Climate change attribution studies and model simulations
When we have all the data and observations, we feed them into a computer model. This model runs two different simulations.
The first model simulates the climate as it is today, including climate change driven by humans.
The second simulation removes the human influence on things like greenhouse gases. This model simulates a climate closer to what existed before the Industrial Revolution.
Comparing these simulations lets us see what effect climate change had on an event. This might include many variables, like temperature and rainfall.
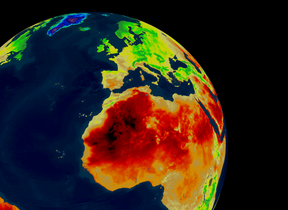
An attribution case study: The European heatwave in 2019
In July 2019, we saw record breaking temperatures across the UK and Western Europe. In Cambridge, we saw a temperature of 38.7°C — the UK’s highest daily maximum temperature ever on record.
Vautard et al. (2019) did an attribution study on the 2019 European heatwave. They asked if climate change influenced the intensity and likelihood of the high temperatures we saw.
This is the full question they studied:
“...whether and how the probability of 3-day average temperature as high or higher than the observed temperature in different places in Western Europe has changed as a result of human-induced climate change.”
They collected observations from stations throughout Europe. Some locations held records going back as far as the 1800s.
Two different climate models generated the data. One simulated today’s climate, with human-driven climate change. Another model simulated the climate before the Industrial Revolution, without human-driven climate change.
Results from the study show that July 2019 heatwave was about ten times more likely because of climate change. The temperatures we saw were 1.5–3°C hotter than they would have been without human influence.
More information about extreme weather events and attribution studies
Extreme weather events in the UK and around the world
- UK and Global extreme events — Cold
- UK and Global extreme events — Drought
- UK and Global extreme events — Heatwaves
- UK and Global extreme events — Heavy rainfall and floods
- UK and Global extreme events — Wind storms
Attribution studies into specific extreme weather events
- 2025 annual mean temperature record - Jan 2026
- Summer 2025 record breaking mean temperature - September 2025
- May 2024 record breaking mean temperature - September 2024
- Autumn and Winter storms over UK and Ireland are becoming wetter due to climate change - May 2024
- 2023 was second warmest year on record for UK - January 2024
- Joint-warmest September on record for the UK - October 2023
- Three consecutive tropical nights now likely in the UK - Sept 2023
- Record-breaking UK June mean monthly temperature - Jul 2023
- 2022 annual mean temperature record - Jan 2023
- Record-breaking 40°C in UK by World Weather Attribution - Jul 2022
- Chances of record breaking June in western Europe - Jun 2022
- World-famous cherry blossom in Kyoto shifted forward by climate change and urban development - May 2022
- Record-breaking heatwave in north-west India and Pakistan - May 2022
- European winter rainfall patterns - May 2022
- Europe's record 2021 summer - Nov 2021
- Europe experiences warmest year on record in 2020 - Aug 2021
- UK weather in 2020 - Jan 2021
- Record-breaking UK rainfall - Oct 2020
- 2020 Siberian heatwave - July 2020
- Chances of seeing 40°C days in the UK - June 2020
- Increasing wildfire risk - Jan 2020
Reflections on extreme events on the increase in a changing climate
- Professor Peter Stott explores what the science tells us in relation to droughts, heat, wildfires and rainfall/flooding. March 2022
- Professor Peter Stott examines extreme weather events around the world and how attribution studies can assess whether these are as a result of anthropogenic (human-induced) climate change. March 2022