Decadal Forecasting - What is it and what does it tell us?
Research news article published in January 2013.
Underpinning science
The climate system consists of four basic elements - atmosphere, ocean, land and cryosphere (land ice and sea ice). Each has its own physical characteristics in terms of thermal capacity, energy balance and hydrological balance. Most importantly, the atmosphere and oceans are free fluids operating on a rotating sphere, such that they are able to move heat and water (importantly salinity in the oceans) around the planet in circulation patterns controlled fundamentally by the Earth's rotation and the distribution of solar heating between the equator and the poles. It is the circulation of the atmosphere and oceans that acts to move heat from the equator to the poles, necessary to produce a stable climate and a planet in net radiative balance.
Add into this the distribution of the land masses, which confine the circulation of the oceans, and mountain ranges, which deflect the flow in the atmosphere, and we have the basic ingredients of the climate system. It is these ingredients that produce the weather in the atmosphere (e.g. mid-latitude cyclones and anticyclones, tropical storms) and 'weather' in the oceans (e.g. El Niño/La Niña, Gulf Stream variability, Indian Ocean Dipole, Atlantic Multi-decadal Variability).
Furthermore the density and hence thermal capacity of the oceans is around 1000 times that of the atmosphere. As a result, water moves much more slowly in the oceans (i.e. currents) than the air does in the atmosphere (i.e. winds). Combined with their greater thermal capacity, the oceans have much longer 'memory' than the atmosphere. So we can see that variations in the ocean - the 'weather' - evolve more slowly and live much longer than the weather in the atmosphere.
There are strong analogies between weather forecasting for a few days ahead and longer-term decadal forecasts for the next few years. When we make a weather forecast we are predicting what the likely evolution of the atmospheric circulation will be over the next few days; when we make a decadal forecast we are essentially predicting ocean 'weather' - in other words how the oceanic circulation will evolve over the next few years and its subsequent impact on the atmosphere. The different timescales for these forecasts reflects the differences in density and thermal capacity noted above.
With both forecasts we need to know the current state of the system, predominantly the atmosphere and land surface for weather forecasting, and the ocean for decadal forecasting. Just as weather forecasts differ depending on what date they are made, so do decadal forecasts. Similarly, just as we increasingly recognize that weather forecasts have to be probabilistic because of the chaotic nature of the atmosphere, so too do decadal forecasts because the ocean is also a chaotic system - but chaotic on longer timescales. A decadal forecast system therefore consists of a number of forecasts, each in this case 10, called an ensemble and the output of the system is a range of plausible outcomes.
How do we make decadal forecasts?
Decadal forecasts are specifically designed to forecast fluctuations in the climate system over the next few years through knowledge of the current climate state and multi-year variability of the oceans.
Decadal forecasts are produced using state-of-the-art climate models which include the four fundamental elements of the climate system, with comprehensive representation of the key fluid dynamics, thermodynamics and radiative transfer. The physical formulation of these models is the same as those used for climate change projections. In the case of the Met Office, the atmospheric component is the same as that used in global weather forecasting, with the result that the model is tested and evaluated on a daily basis.
Because decadal forecasts start from the current state of the climate system they also include the current state of greenhouse gas and aerosol loadings in the atmosphere and how these are expected to evolve over the period of the forecast i.e. the next few years. The change in radiative forcing is, of course, small over the period of the forecast, and so the forecast outcome, at least in first few years, is likely to be dominated by natural variations in the climate system, predominantly from the 'weather' in the oceans. Likewise forecasts made, say, a year apart are likely to differ because they start from a different initial condition, and ocean 'weather' will evolve differently.
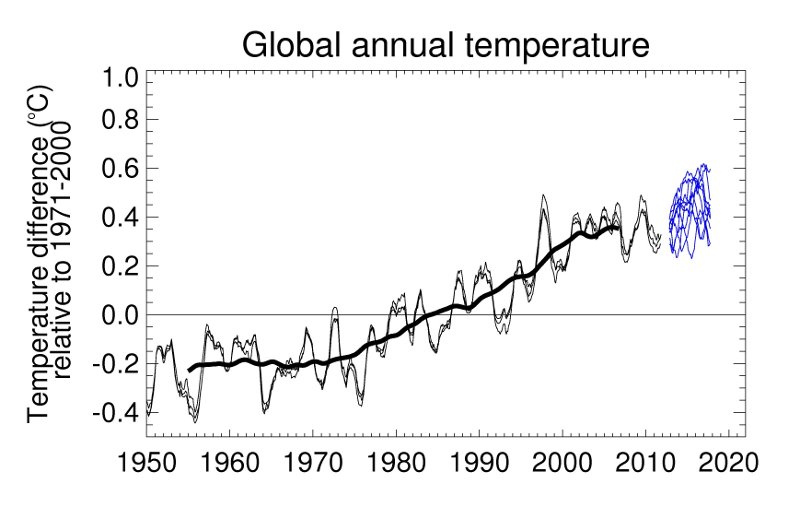
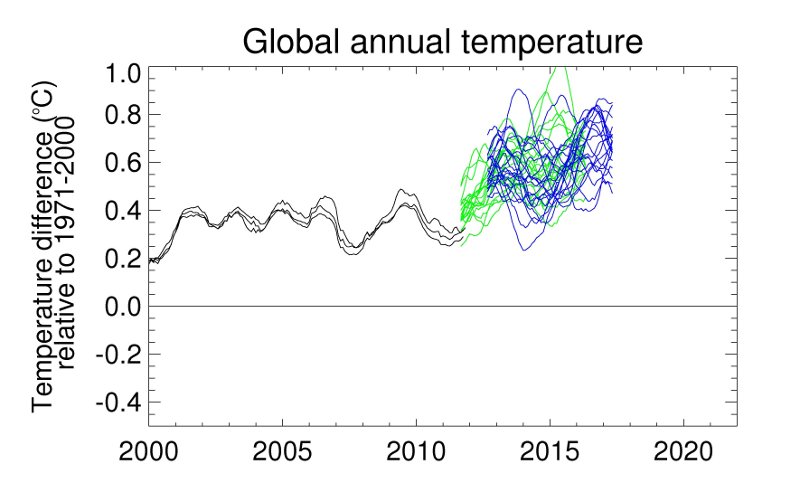
The oceans interact strongly with the atmosphere, and so ocean 'weather' can change the patterns of weather in the atmosphere (as with the well known global impacts of El Niño/La Niña) and also affect temperatures and rainfall over land. The impacts of different aspects of ocean variability on the global mean temperature have been well-documented, and show that El Niño/La Niña can warm/cool global mean temperatures by at least 0.10C (e.g. Trenberth et al. 2002 ). Likewise Atlantic Multi-Decadal Variability, related to changes in the strength of the Thermohaline Circulation, can also affect global mean temperatures by a similar magnitude (Knight et al. 2005 ). We can see the influence of these natural variations imprinted on top of the long-term global warming trend in the global temperature record shown in Figure 1 (e.g. the peak warming in 1998 related to an exceptionally strong El Niño).
Why do we make decadal forecasts?
Decadal forecasting is an extremely challenging area of research, not least because long-term comprehensive observations of the ocean do not exist to help us understand how the global oceans behave over annual, decadal and longer timescales. But decadal forecasting is immensely valuable, scientifically, because it represents a stringent test of how well the model simulates natural variability and also how well it captures the longer term anthropogenic warming trend.
In terms of their application for climate change policy and to underpin other decision-making, decadal forecasts provide guidance on how near-term trends in global warming are likely to evolve in the next few years and what role natural variability may play.
Increasingly there is a growing need for advice on what the climate volatility, i.e. the frequency and intensity of hazardous weather and climate extremes, will be like over the next decade at the regional scale, to guide infrastructure and resilience planning. There is emerging evidence that the climate is becoming more volatile and that the incidence of unprecedented (at least over the last century) extreme events (e.g. Texas drought, Australia's recent extreme temperatures and wildfires, UK flooding) is rising, with larger and larger impacts on societies around the world.
Decadal forecasting has, potentially, an important role to play here in assessing the probability of such extremes in the next few years, because they combine both natural variability and climate change. It has already been demonstrated that skillful multi-year predictions of Atlantic hurricane frequency can be produced (Smith et al. 2010). Much more remains to be done to exploit the regional information in decadal forecasts and indeed in climate predictions on all timescales from months to the end of the century. This is one of the main drivers of the latest Hadley Centre Climate Programme.
How should we interpret the latest decadal forecast?
The Met Office Hadley Centre published an experimental decadal forecast in 2007. Since 2009, initialised forecasts out to 5 or 10 years have been produced and made available for DECC and Defra. To ensure that the forecast starts from the most recent state of the climate system, it is run during December and posted on the Met Office Research pages by the end of the year. Because this is still at the cutting edge of research, the forecast is not publicized, but in the spirit of openness and transparency, it is available to anyone who wishes to view it.
In 2012 the Met Office Hadley Centre introduced its latest model version, HadGEM3, into the decadal forecast system. It replaced an earlier model, HadCM3, which was developed over 10 years ago and has been used widely in the IPCC Assessments and formed the basis of the UK Climate Projections published in 2009 (UKCP09). HadGEM3 represents the consolidation of many years' research, greater scientific understanding, and substantial improvements to the physics of the model. Because of the computational expense of the new model, it is only feasible to run the forecast out for the next 5 years, whilst retaining the current size (10) of the ensemble.
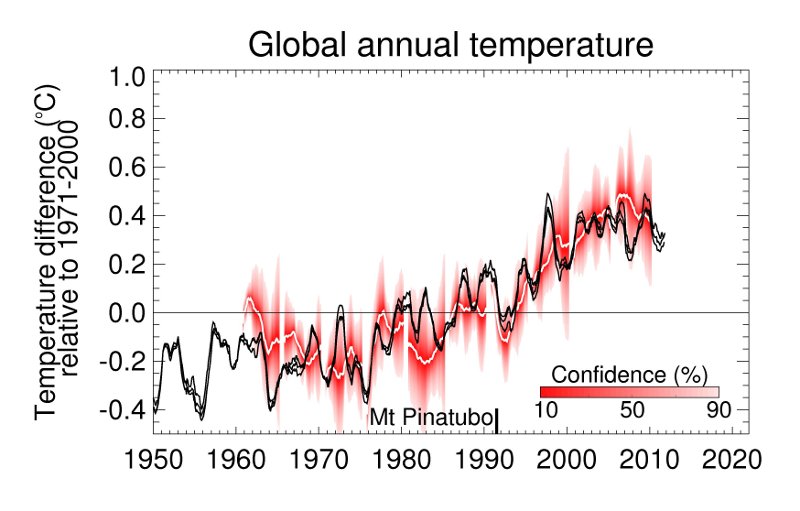
As with all new forecasting systems, stringent testing and evaluation has been performed. 5-year ensemble forecasts of the past climate (often termed hindcasts), through the last 50 years, have been produced. The results of those tests (Figure 2) show that the model has demonstrable skill (correlations of 0.63 in the global distribution of surface temperature averaged over years 2 to 5 of the forecast), capturing both the warming trend and several of the major excursions from the long term trend. Not surprisingly, the forecasts do not capture every peak and trough in the observed curve, because we know that the predictability of phenomena like El Niño/La Niña is limited to at most a year in advance.
The latest decadal forecast, issued in December 2012, is shown in Figure 1 as the set of blue lines, each representing an individual forecast from the 10-member ensemble. The results show that the Earth is expected to maintain the record warmth that has been observed over the last decade, and furthermore a substantial proportion of the forecasts show that new record global temperatures may be reached in the next 5 years.
Looking in more detail, Figure 3 shows the average distribution of surface temperature anomalies (relative to 1971-2000 climatology) for the 5-year period, November 2012 to October 2017, based on the most likely outcome (A), and the lower (B) and upper (C) estimates.
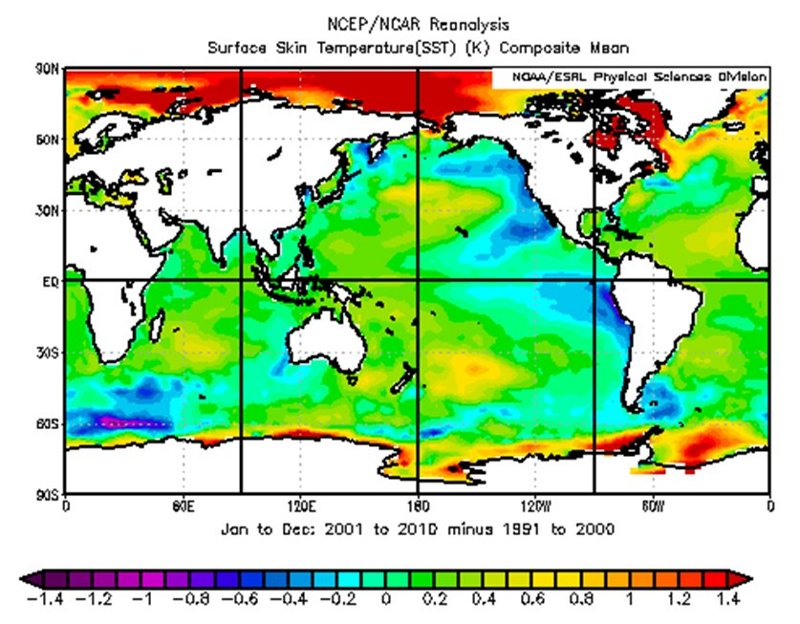
All the distributions show greater warming over most land areas than over the oceans, and enhanced warming over the Arctic, all consistent with global warming. Two further features stand out. All the forecasts show a change to much cooler ocean temperatures in the North West Atlantic, which could be indicative of a change in the Atlantic Meridional Overturning Circulation. This area of the North Atlantic has been exceptionally warm in the last few years (Figure 4), so if these forecasts are correct then this suggests a big change in Atlantic Multi-Decadal Variability. This will be investigated in much more detail over the coming months and the implications for the climate of the UK and western Europe explored.
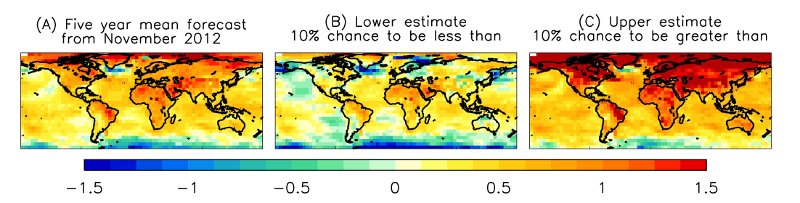
Similarly relative cooling in the north-east and south-east Pacific Ocean compared to other parts of the global oceans is also evident in Figure 3. The pattern of this cooling is similar to that observed in the Pacific Decadal Oscillation, and has been a notable difference in ocean temperatures between the 1990s and 2000s (Figure 4). Were this cold phase to continue as forecast, this would act to moderate global warming in the next few years, as it has over the last decade.
Do decadal forecasts tell us anything about long-term climate change?
Decadal forecasts provide essential information about ocean 'weather' and how it will evolve in the next few years in the context of a globally warming world, but they do not tell us anything about long-term climate sensitivity (i.e. how much the planet will warm for a specified increase in radiative forcing related to greenhouse gases). There has been a debate about why the decadal forecasts from 2012 are indicating a slower rate of warming in the next 5 years than the forecasts made in 2011. Such a change in the forecast is entirely possible from the natural variability in ocean 'weather' and the impact that has on global mean temperature.
There have also been suggestions that the change in the forecast is related to the change in the system with the replacement of HadCM3 with HadGEM3, and that the slower rate of warming with HadGEM3 indicates a reduction in the climate sensitivity and hence less long-term climate change. There is no evidence to support this interpretation. Although centennial projections of climate change have still to be produced with HadGEM3 - the focus of model development and evaluation has rightly been on ensuring that the model captures the current climate and its variability correctly - early results suggest that the climate sensitivity of the model is well within the expected range. In fact, parallel forecasts starting from 2012 with HadCM3 (Figure 5) also show a slower rate of warming in the next 5 years and also show a cooling of the North West Atlantic.
Conclusions
Decadal forecasts are specifically designed to forecast fluctuations in the climate system over the next few years through knowledge of the current climate state and multi-year variability of the oceans.
Decadal forecasting is immensely valuable, scientifically, because it represents a stringent test of how well the model simulates natural variability and also how well it captures the longer term anthropogenic warming trend. It also has a broad range of potential applications in terms of policy making and investment decisions.
The latest decadal forecast, issued in December 2012, show that the Earth is expected to maintain the record warmth that has been observed over the last decade, and furthermore a substantial proportion of the forecasts show that new record global temperatures may be reached in the next 5 years.
Decadal forecasts provide essential information about natural variability and how it will evolve in the next few years in the context of a globally warming world, but they do not tell us anything about long-term climate sensitivity (i.e. how much the planet will warm for a specified increase in radiative forcing related to greenhouse gases). There is no evidence that current estimates of climate sensitivity produced by the Met Office Hadley Centre have changed.
References
- Trenberth K E, Caron J M, Stepaniak D P and Worley, S (2002) Evolution of El Nino-Southern Oscillation and global atmospheric surface temperatures. J. Geophys. Res., 107, No. D8, 10.1029/2000JD000298
- Knight J R, Allan R J, Folland C K, Vellinga M and Mann M E (2005) A signature of persistent natural thermohaline circulation cycles in observed climate. Geophys. Res. Lett. 32 L20708
- Smith, D M, Eade, R, Dunstone, N J, Fereday, D, Murphy, J M, Pohlmann, H and Scaife, A A (2010). Skilful multi-year predictions of Atlantic hurricane frequency. Nature Geoscience, 3, 846-849, doi:10.1038/ngeo1004