Assimilation of new low-cost wind observations from aircraft
April 2019 - New low-cost wind observations from aircraft are now being assimilated in the Met Office's high-resolution UK model.
In situ upper air observations of the atmosphere have been of interest to meteorologists since the first thermometers were flown on kites in the mid-1700s. Kites were still used for routine observations into the early 1900s. The advent of hot air balloons and later aircraft increased the capability, bringing observations of different parameters at higher altitudes. In the 1920s the first weather balloons were developed with radio transmitters to send back near real time data. From then until the 1980s weather balloons (radiosondes) continued to develop, supplanting kites, aircraft and manned balloons for the operational collection of in situ upper air meteorological measurements. The advent of Numerical Weather Prediction (NWP) during this time took advantage of these measurements.
During the 1980s the significant increase in the connectivity of commercial aircraft provided a new avenue for this type of measurement. The Aircraft Meteorological Data Relay (AMDAR) system was developed and adopted by different national meteorological services and airlines to provide a greater number of automatic near real time observations of wind and temperature.
NWP model resolution has continued to grow, but it hasn’t been feasible to increase the number of weather balloon or AMDAR observations to keep pace with this increase. Other methods of getting in situ upper air observations were required. Since 2011 the Met Office has been investigating a new method of collecting low cost observations. Over the UK most commercial aircraft are continuously broadcasting information for air traffic management; this information is defined by the Mode-Selective (Mode-S) Enhanced Surveillance (EHS) and Automatic Dependent Surveillance Broadcast (ADS-B) standards. ADS-B data is continuously broadcast, whereas Mode-S EHS data requires an interrogation from air traffic management secondary surveillance radar, limiting its availability to within range of those radars (Figure 1).
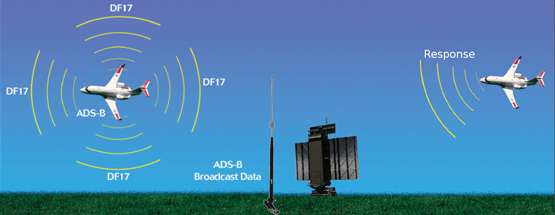
Figure 1: Navigational data broadcast from aircraft for Air Traffic Control and other aircraft may be freely intercepted using equipment designed for and by aircraft enthusiasts.
The Met Office has invested in its own network of small, relatively low-cost receivers to collect the data being transmitted by the commercial aircraft. This information contains the current state of the aircraft, including its air movement vector and ground movement vector. The difference between these two vectors is the wind that is acting on the aircraft (Figure 2). The Met Office network currently collects approximately 100 000 000 messages a day. After processing and quality control this results in more than 5 000 000 upper air wind measurements per day, a 500-fold increase in the number of aircraft observations available for NWP over the UK. Figure 3 gives an idea of the daytime coverage of Mode-S data collected by the six current receiver stations. 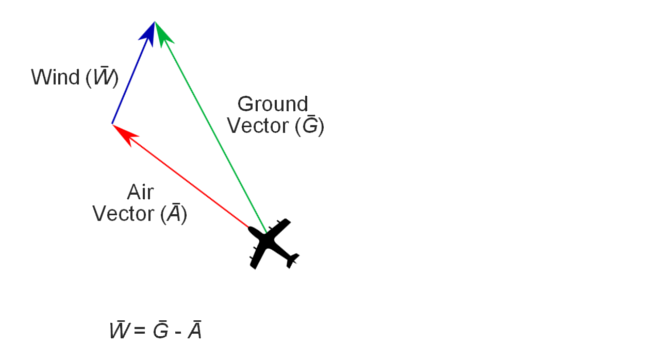
Figure 2: Derivation of wind vector from the ground and air vectors.
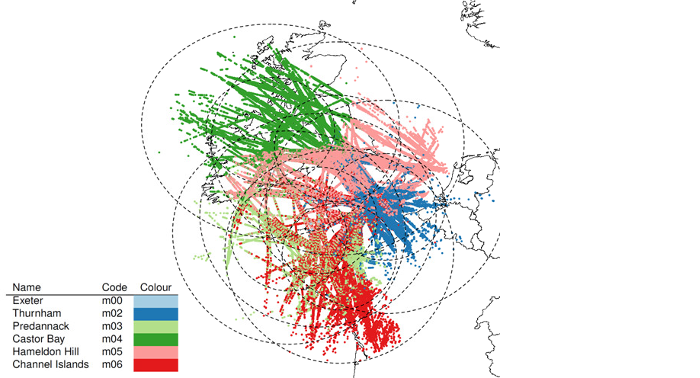
Figure 3: Example of typical daytime Mode-S data coverage for a single hour from the six current receivers.
Over the last 6 years the quality of these wind observations has been assessed in several ways including comparisons to AMDAR, research flight investigations using both inter-comparisons and synthesised observations, and 5 years of routine comparisons to the model forecast fields. Understanding the accuracy of the observations enables the Met Office scientists to utilise the new measurements in the most efficient way.
Because Mode-S observations are a particularly dense observation type, it is necessary to thin them in both space and time to reduce observation redundancy and correlated biases. Sensitivity studies were conducted in the hourly cycling 4D-Var data assimilation system of the 1.5km UKV model to arrive at a near-optimal thinning strategy for the data.
After successful research trials to evaluate the impact on forecasts from the assimilation of Mode-S wind observations, this upgrade was introduced into our Parallel Suite 42 (PS42) which ran from late November 2018 to early March 2019. When assessed relative to the current operational UKV forecasting system (OS41) baseline, the principal benefit from Mode-S appears to be an improved fit to upper level winds up to 12 hours into the forecast which is most prominent around aircraft cruise levels and reflects the vertical distribution of Mode-S observations (Figure 4). There is also some evidence of benefit for the short-period forecast of precipitation.
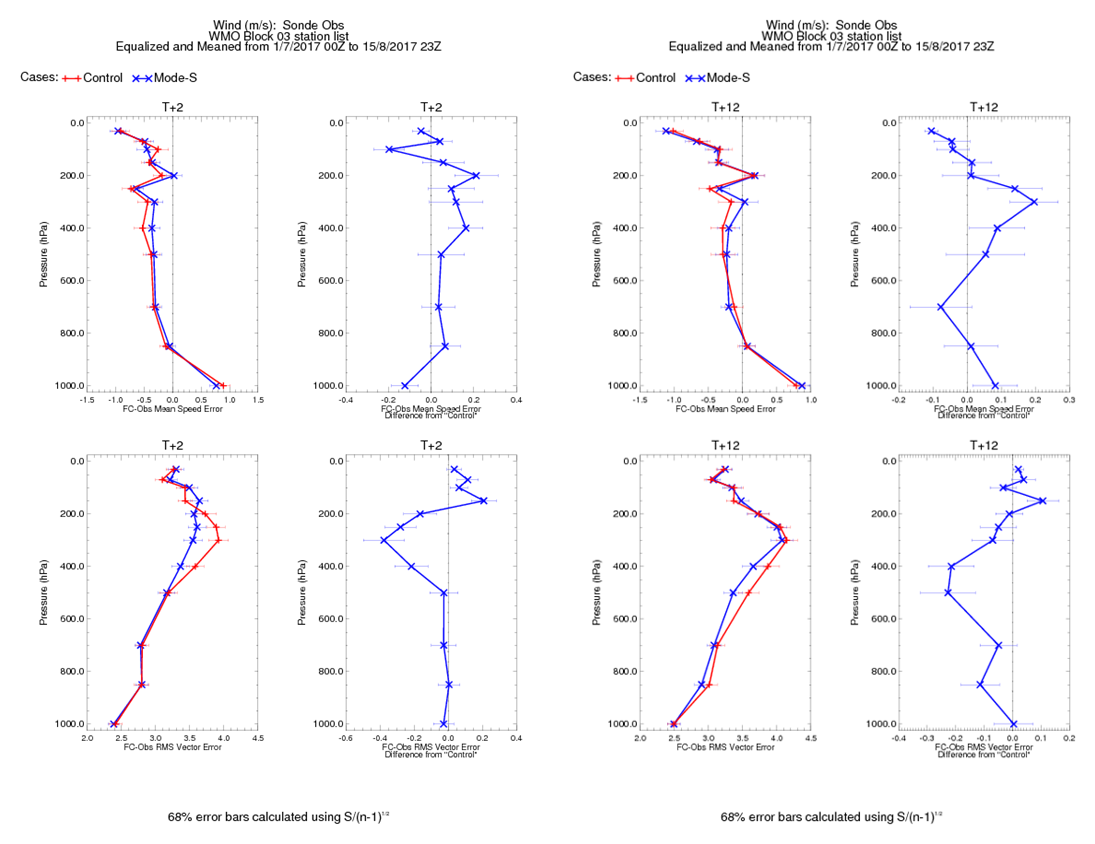
Figure 4: Summer Upper-Air wind forecast errors as measured against radiosondes. Impact from system with Mode-S data (blue) compared with a control system (red) at T+2 hours (left) and T+12 hours (right): wind speed bias (top) and Root-Mean-Square (RMS) vector wind error (bottom). The right-hand panels in each group of four show the differences from the control.
The current network of six receivers, owned and operated by the Met Office, is soon to be expanded (Figure 5). The planned network will include a receiver at most Met Office operational radar networks, and two additional sites. Whilst this will increase the number of observations, it is the location of the receivers to cover more airports, providing profiles from aircraft near the ground up to cruise level, that will hopefully provide some further benefit to the forecast skill.
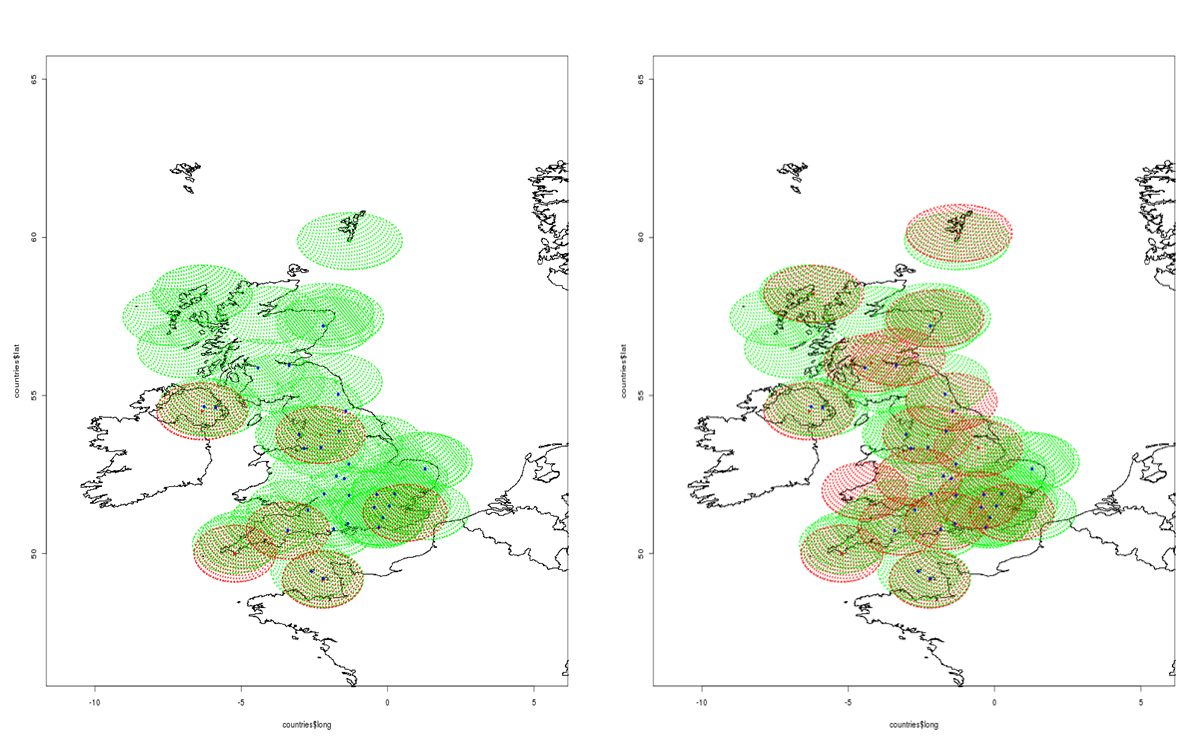
Figure 5: Current six receiver network (left) and planned network expansion (right). The green hatched circles indicate where Mode-S EHS data are likely to be available, with the red hatched circles showing the good coverage areas of the receivers.