New marine surface humidity climate monitoring product
November 2020 - Our new climate monitoring product HadISDH.marine provides yet more evidence of a changing climate.
The Met Office, in collaboration with the National Oceanography Centre, have produced a new climate monitoring dataset for surface humidity over oceans. The dataset is called HadISDH.marine which stands for the Met Office Hadley Centre Intergrated Surface Dataset of Humidity for the marine atmosphere. It is designed to be used alongside the existing HadISDH.land to provide a global monitoring capability for studying large scale trends and variability, assessing the validity of climate models and understanding climate change. The dataset is described in a new paper (Willett et al. 2020).
HadISDH.marine is a monthly average 5 ° by 5 ° gridded product spanning January 1973 to December 2019. It will be updated annually every January. The data have been quality controlled and adjusted for known biases in ship heights and instruments. The remaining uncertainty has been estimated at the gridbox and regional scale, accounting for observation uncertainty, gridbox observation density and regional coverage. HadISDH.marine provides seven variables including the specific humidity (q), which is a measure of the amount of water vapour in grams per kilogram of moist air, the relative humidity (RH), which is a measure of saturation, and the simultaneously measured air temperature (T). It shows (see Figure 1) that the amount of water vapour over oceans has increased, in concert with warming air temperature, but suggests that the air over ocean may have become less saturated.
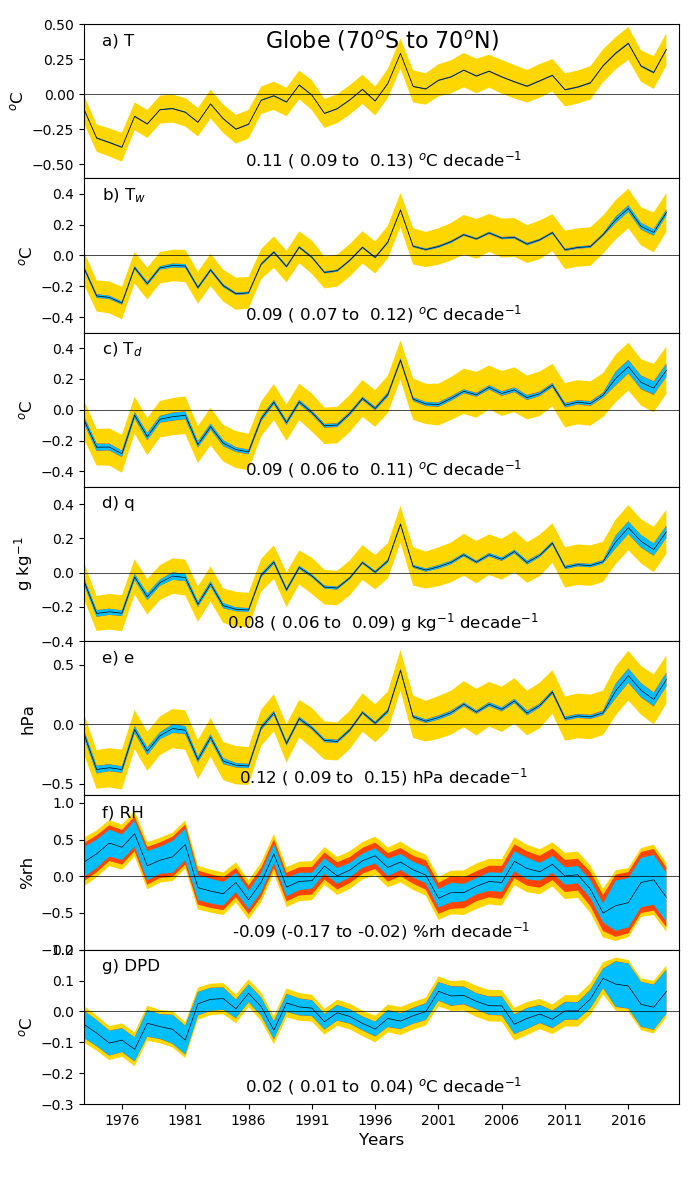
Figure 1 Global timeseries of annual mean surface humidity climate anomalies for all variables. The 2 sigma ranges for observation (blue), gridbox observation density (red) and spatial coverage (gold) uncertainty contributions combined are shown. All timeseries have been given a mean of zero over the common 1981-2010 period. Decadal linear trends and 90th percentile confidence intervals (in parentheses) were fitted using ordinary least squares regression with AR(1) correction applied when calculating the confidence intervals (Santer et al., 2008).
Water vapour is fundamental to life on Earth. Without water vapour in our atmosphere acting as a greenhouse gas, our planet would be far too cold to support life as we know it. However, as with all things, balance is important. Changing water vapour amounts impact our climate and society in several different ways. Water vapour is the source of water for rain and higher levels of water vapour can lead to heavy rainfall events becoming more intense. The amount of water available and the saturation of the air are important to plants and therefore our ability to grow food. The saturation levels can influence the frequency and severity of wildfires. Water vapour and saturation also affect the mechanisms we, and other animals, use to keep our bodies cool and avoid heat stress such as sweating and panting.
We know that surface humidity is changing over land – the amount of water vapour in the surface atmosphere has increased significantly from the 1970s, which is when enough data were available digitally to enable global monitoring. Although there has been an increase in water vapour, we also see that the air has become less saturated – the relative humidity has decreased over land. This makes sense because the oceans are the main source of water vapour, even for the air over land, thanks to the wind blowing air around the globe. They have warmed more slowly than the land. Therefore, there hasn’t been sufficient water evaporated from the oceans and held in the air above the oceans to keep the land atmosphere saturated to the same level.
However, the spatial and temporal pattern of decreasing relative humidity is not well understood. It is also not well represented by climate models. This does not bring future warming into question but suggests uncertainty in the scale of future climate impacts related to the water cycle such as flooding and droughts, plant growth and food availability, and heat stress.
In order to understand what is happening with surface humidity we need to be able to look at it over land and over ocean. Until now only reanalyses-based climate monitoring products were available to study humidity over oceans. Reanalyses are very useful tools that provide globally complete representations of our climate by blending a weather forecast model with observations from weather stations, ships, buoys, radiosondes and satellites. However, they have issues of long-term stability because of the changing input data streams. Additionally, over ocean, where many observations come from ships and buoys, the humidity data are more uncertain because of biases from different ship heights and different instrumentation. HadISDH.marine has adjustments applied to account for these biases. In summary, all climate monitoring products have some data quality issues but by applying methods to reduce these and comparing several independent products we can work out what we are confident in and where there are greater uncertainties. Hence, the need for HadISDH.marine as a new monitoring product to compare with reanalyses.
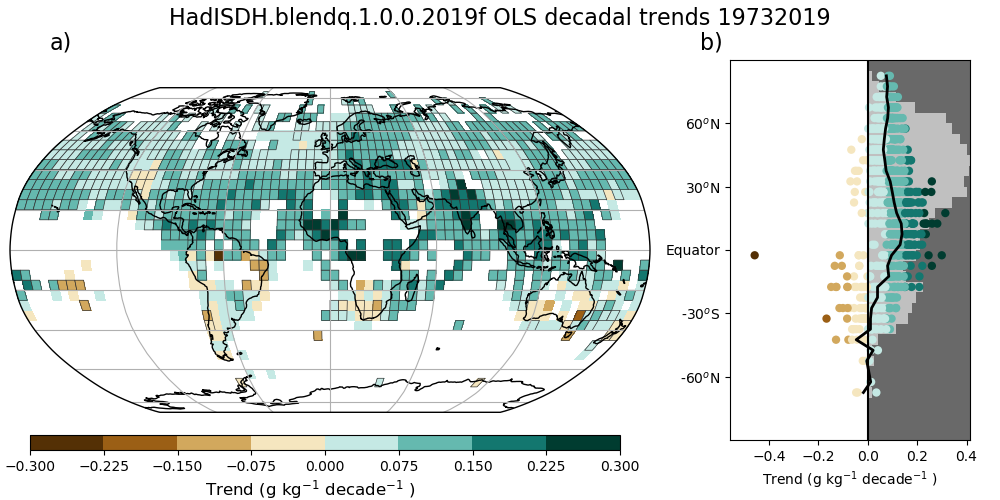
Figure 2 Linear trends in specific humidity (g kg-1) from HadISDH.marine and HadISDH.land combined over 1973 to 2019. Decadal linear trends were fitted using Ordinary Least Squares regression when there are at least 70 % percent of months present over the trend period. Gridboxes with boundaries show significant trends in that the 90 % confidence interval (calculated with AR(1) correction following Santer et al., 2008) around the trend magnitude is the same direction as the trend and does not encompass zero. The right-hand panel (b) shows the distribution of gridbox trends by latitude with the mean shown as a solid black line. Light grey shading shows the proportion of the gridded globe that contains observations.
The combined HadISDH.marine and HadISDH.land show that specific humidity has increased by approximately 0.08 g kg -1 10yr -1 since 1973, with moistening widespread across most of the globe (Figure 2). This equates to 94 000 Olympic-size swimming pools (50 x 25 x 2 m) worth of extra water in the bottom 1 m of the atmosphere, almost enough water to fill Lake Windermere (Lake District, UK). This result is not surprising. The air temperature has increased and therefore we expect the amount of water vapour in the atmosphere to increase. This is because in a warmer climate there is more energy to evaporate water from the ocean and land surface, and more energy to hold that water as a gas in the air.
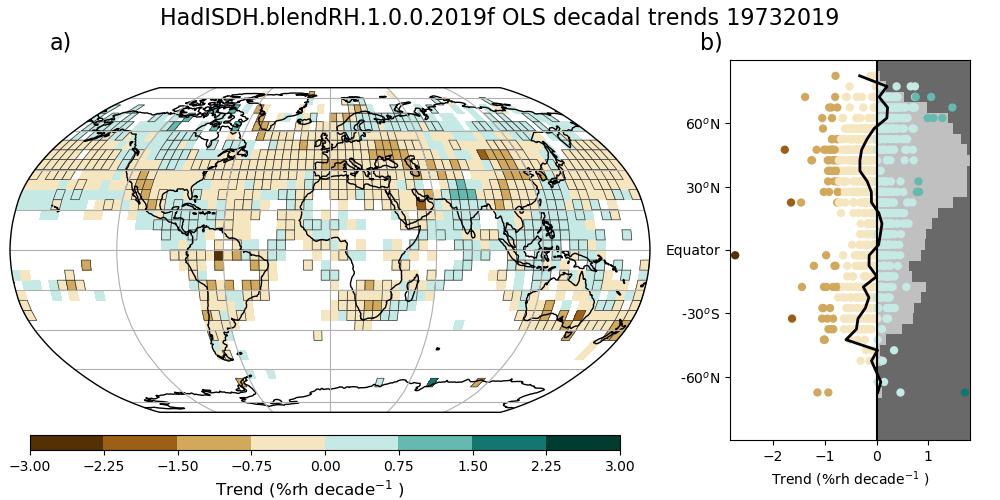
Figure 3 Linear trends in relative humidity (%rh) from HadISDH.marine and HadISDH.land combined over 1973 to 2019. Decadal linear trends were fitted using Ordinary Least Squares regression when there are at least 70 % percent of months present over the trend period. Gridboxes with boundaries show significant trends in that the 90 % confidence interval (calculated with AR(1) correction following Santer et al., 2008) around the trend magnitude is the same direction as the trend and does not encompass zero. The right-hand panel (b) shows the distribution of gridbox trends by latitude with the mean shown as a solid black line. Light grey shading shows the proportion of the gridded globe that contains observations.
However, rather surprisingly, the relative humidity (saturation) levels in HadISDH.marine have decreased by -0.09 %rh 10yr-1 since 1973. Although this is consistent with the fact that relative humidity has also decreased over land, unlike for the land there is no clear mechanism to explain decreasing relative humidity over ocean. In fact, current understanding and climate models suggest that relative humidity should remain almost constant or slightly increase in a warmer climate (Held and Soden, 2006; Schneider et al., 2010; Byrne and O’Gorman 2013, 2016, 2018). The uncertainty in relative humidity is also large, much larger than for specific humidity (Figure 1). The size of the uncertainty is large enough to make us unsure about the fact that relative humidity over ocean is decreasing. On the other hand, there are some things that suggest the decrease in relative humidity over oceans might be real. The decrease is present in all versions of the HadISDH.marine dataset and is not a result of the bias adjustments or quality control applied to the data. The decrease is also widespread across the globe (Figure 3) rather than driven by clusters of clearly bad data that stand out as different from the rest. The decrease is spatially consistent with the decrease over land in many regions, although not all. The decrease is also seen in both the ERA5 and ERA-Interim reanalyses. However, the pattern and magnitude of the decrease over time is very different between all three estimates and we know that there are issues with the ocean surface humidity from reanalyses.
In summary, HadISDH.marine is a much needed addition to the tools we use to monitor climate change, understand our climate system and improve climate models. It shows widespread increases in water vapour for which we have high confidence. The levels of saturation, as measured by the relative humidity, are always more susceptible to biases and errors. There are a few reasons for this. Relative humidity tends to vary more over shorter periods of time and over smaller distances than specific humidity. Also, it is affected by errors in measurements of both air temperature and water vapour. Surprisingly, HadISDH.marine shows decreasing relative humidity over time. This is a very uncertain result and requires further research to assess how real it is and the implications of it.
References
Byrne, M. P. and P. A. O’Gorman, 2013: Link between land‐ocean warming contrast and surface relative humidities in simulations with coupled climate models. Geophysical Research Letters, 40 (19), 5223-5227, https://doi.org/10.1002/grl.50971.
Byrne, M. P. and P. A. O'Gorman, 2016: Understanding decreases in land relative humidity with global warming: conceptual model and GCM simulations. Journal of Climate, 29, 9045-9061, DOI: 10.1175/JCLI-D-16-0351.1.
Byrne, M. P. and O’Gorman, P. A.: Trends in continental temperature and humidity directly linked to ocean warming, Procedings of the National Academy of Sciences USA. 115(19), 4863-4868. doi: 10.1073/pnas.1722312115, 2018.
Held, I. M. and Soden, B. J., : Robust responses of the hydrological cycle to global warming. Journal of Climate, 19, 5686-5699, 2006.
Santer, B. D., Thorne, P. W., Haimberger, L., Taylor, K. E., Wigley, T. M. L., Lanzante, J. R., Solomon, S., Free, M., Gleckler, P. J., Jones, P. D., Karl, T. R., Klein, S. A., Mears, C., Nychka, D., Schmidt, G. A., Sherwood, S. C. and Wentz, F. J.: Consistency of modelled and observed temperature trends in the tropical troposphere. Int. J. Climatol., 28, 1703-1722. doi:10.1002/joc.1756, 2008.
Schneider, T., O ’Gorman, P. A. and Levine, X. J.,: Water vapor and the dynamics of climate changes, Reviews in Geophysics, 48, RG3001, doi:10.1029/2009RG000302, 2010.
Willett, K. M., Dunn, R. J. H., Kennedy, J. J., and Berry, D. I.: Development of the HadISDH.marine humidity climate monitoring dataset, Earth Syst. Sci. Data, 12, 2853–2880, https://doi.org/10.5194/essd-12-2853-2020, 2020.