Tropical cyclone forecast error charts - north-west Pacific
Tropical cyclone forecast error charts - north-west Pacific
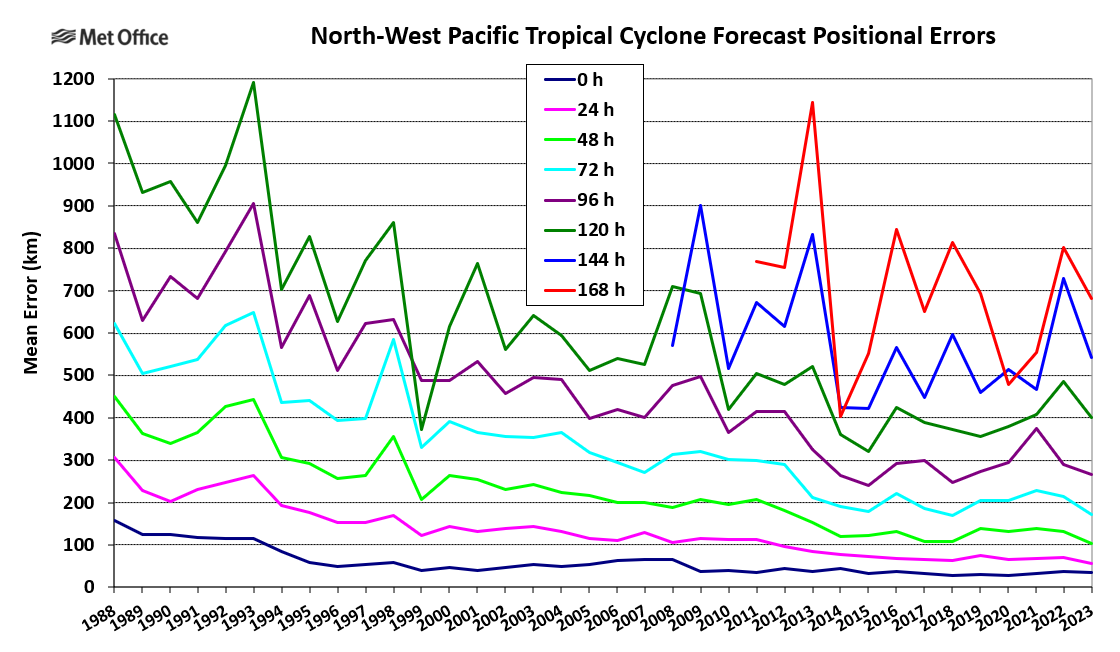
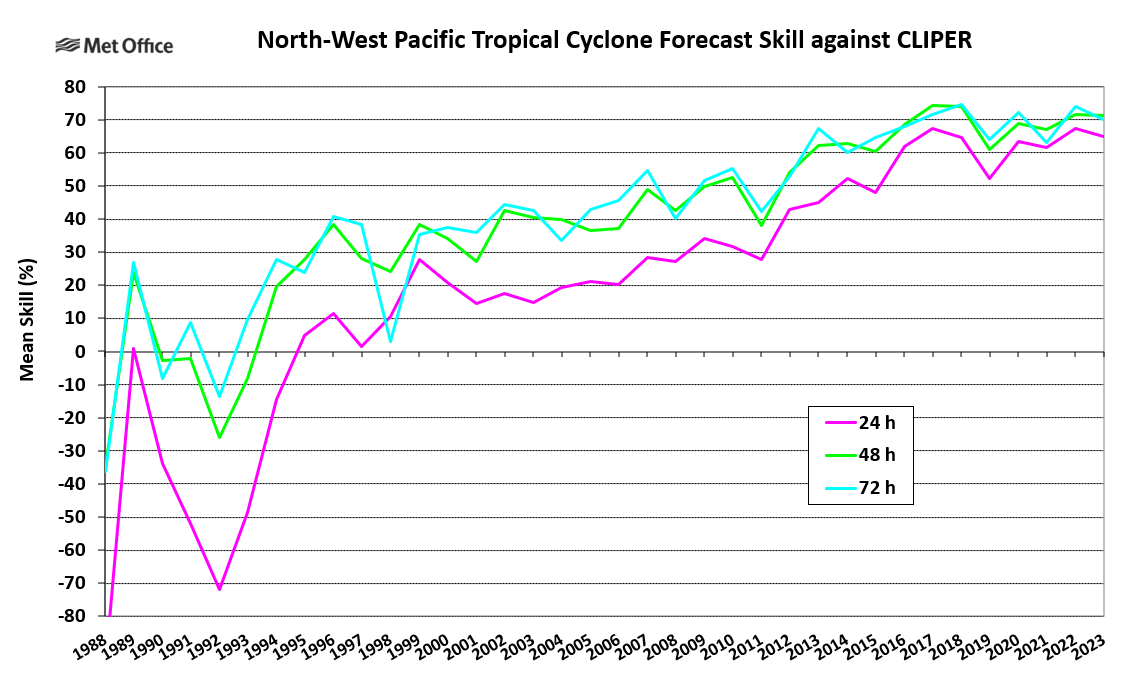
The graphs below show a variety of measures of forecast errors and forecast skill for the Met Office global model forecasts of tropical cyclones in the North-West Pacific region (west of 180 degrees longitude).
For those not familiar with the types of error statistics used in tropical cyclone forecast assessment and their sign conventions a diagrammatic explanation is available.


