Modelling consumer demand during unprecedented times
Nick Law, Senior Account Manager, Water, shares how the Met Office has collaborated with industry to forecast water demand during COVID-19 lockdown in 2020.
Content
- How did lockdown change water demand?
- Collaborating to develop a new demand model
- Demand planning for the ‘new normal’
- Preparing for the future
The COVID-19 pandemic has brought many changes and challenges to life in the UK. Government guidance to contain and reduce virus transmission has reshaped day-to-day living in ways we haven’t seen before. This has brought about many changes, from how much electricity we use, to the way we consume water.
Along with our water team at the Met Office, I have been working with water companies throughout this period to help identify the changes and trends in water use during lockdown. The ultimate goal of this work was to develop a new water demand model to predict demand more accurately.
How did lockdown change water demand?
We compared water use before the first lockdown (February 2020 to early March 2020) to the start of lockdown (late March 2020 to early April 2020). Figure 1 below shows that most water companies saw an increase in average water consumption during lockdown. Companies covering predominantly suburban areas (G and H) saw the most noticeable increase, whereas companies operating in city areas saw a reduction in water use (A). The data also showed differences between weekday and weekend water consumption largely disappeared.
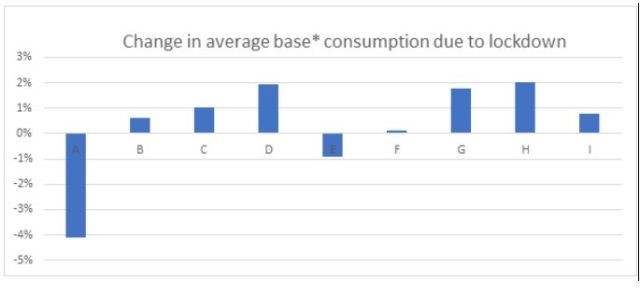
Figure 1) Percentage change in daily average base water consumption for ten water companies in early lockdown (late March-early April) compared to before lockdown (February-early March)
Lockdown during March 2020 and May 2020 coincided with a prolonged spell of sunny, warm and very dry weather. This introduced a ‘fine spring weekend’ effect to every day. The data suggests water use during this period is more sensitive to weather compared to pre-lockdown, with weather the main driver of day-to-day variations. For example, an increase in temperature appears to cause a higher rise in water demand than it would pre-lockdown. Figure 2 below shows a sharp rise in water use to around 30% above base usage by late May 2020, similar to the peak levels seen during the hot summer of July 2018.
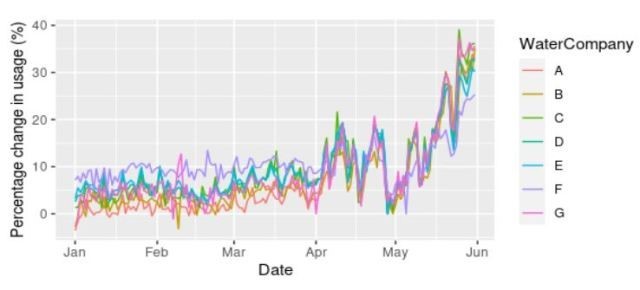 Figure 2) Percentage change in daily water consumption from average during lockdown.
“Lots of us are spending more time at home and along with warm weather we’ve seen customers using water differently.
“Increased demand for tap water in our area is more akin to patterns we see in an exceptionally hot summer. More water is being used on DIY projects and gardening which is contributing to the additional 25% of water we’re treating and pumping through our water distribution system.”
David Hinton, Chief Executive at South East Water, commenting on water consumption during the first lockdown.
Collaborating to develop a new demand model
At the time, water demand models did not take into account these new water use patterns observed during the first lockdown. This created new operational challenges for water companies, who despite having sufficient water supply in their reservoirs, were unable to treat and pump water fast enough to meet the unexpectedly high demand at peak times.
By working together with water companies to identify and understand these patterns, we were able to develop two COVID sensitive demand models – one for the north and one for the south of the UK. They enable water companies to adjust their demand planning and better anticipate water usage as this new way of life continued.
The COVID sensitive demand models were funded by the 11 water companies that came together to form the COVID-19 Water Group. Theyare used in addition to other models that consider the impact of weather conditions and what is considered normal levels.
Having access to data provided by the group on the impact lockdown on water demand, we were able to compare, analyse and forecast water demand for future lockdowns to help water companies make resilient decisions in their demand planning.
Additionally, water companies can use this data analysis and forecasting as a justification to regulators should they need to restrict water usage or experience water shortages.
Demand planning for the ‘new normal’
As time went on, the group has continued to monitor water data for further insight and analysis to assist in water demand forecasting.
From July to August 2020 water demand reached new peaks due to the lockdown restrictions. This was compounded by an increase in weather sensitivity and periods of exceptionally hot weather.
In early July, demand started to rise as warmer, drier weather set in. Figure 3 below shows how drastically demand changed during August. Demand during the first two weeks passed 30% over the base threshold in the southeast. In the second half of August, the onset of cooler, wetter weather improved an increasingly difficult situation for southeast water companies with high demand then plunging by 30% in a matter of days.
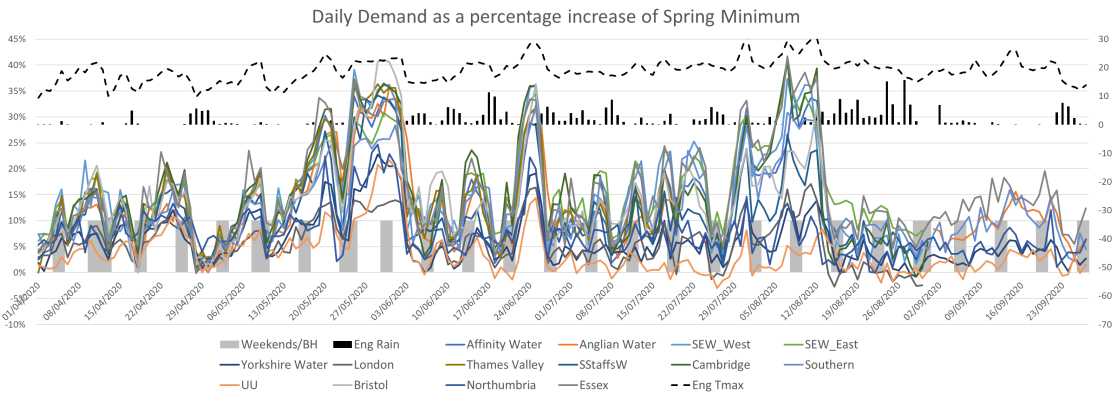
Figure 3) Daily demand as a percentage increase of spring minimum
This graph shows the daily water demand experienced by ten water companies across England from 1 April to 30 September. The data have been normalised to the lowest daily usage in the period from 23 March to 30 April. Each line represents the water demand for a water company expressed as a percentage of the lowest usage. The dashed black line is the mean England maximum temperature for each day and the black bars are the daily England area average rainfall. The grey bars denote weekends and bank holidays.
In September 2020, water demand returned to more normal levels. However, this was now considered to be a ‘new normal’ rather than the demand levels seen pre-COVID-19. This ‘new normal’ means something different for each part of the UK and the associated water provider.
For example, in large metropolitan areas, lower demand of water compared to pre-COVID-19 levels was experienced, compared to the same time period in 2019. Some parts of the country, such as the south-west, experienced a 5-10% uplift in water demand in comparison to pre-COVID-19 levels and the same time period in 2019. Some parts of the country, such as the south-east, return to the standard normal as they were seen to have the same water demand level as they did pre-COVID-19 and in comparison to the same time period in 2019.
Preparing for the future
Historical data and analysis such as this enable us to better support companies in forecasting demand and to prepare for that estimated demand across the UK.
We continue to meet quarterly with the COVID-19 Water Group, with the key focus of understanding the impact of water demand during lockdown. However, the group has also been useful in providing other demand-related support to each other as well as a source of insight sharing. For example, we have been able to identify other areas of expertise and forecasting services that would be useful to water companies, such as the use of sub-seasonal forecasting. Due to these valuable dual purposes, the group intends to remain operational into the future.
Insights
The latest insights and information from our industry experts
View hub ![]()
Get in touch
Call us
We are available 24/7.
0370 900 0100Email us
Fill out this short form and we'll get back to you.
Contact Us formFollow us
Linkedin XGet in touch
Call us
We are available 24/7.
0370 900 0100Email us
Fill out this short form and we'll get back to you.
Contact Us form