Predicting the likelihood and frequency of extreme weather
Senior Statistical Scientist Dr Laura Dawkins turns forecasts into predictions of how a company’s operations might be impacted by various weather phenomena.
Contents
- Predicting future weather events
- What is extreme value analysis
- Quantifying the impacts of natural hazards
- How historical data impacts predictions
- The basis for infrastructure design
- Safety in uncertainty
- Harnessing the value
Recently we’ve seen an increasing number of extreme weather events, like the ‘Beast from the East’ in 2018. The cold wave had a significant impact on national infrastructure and put people’s daily routines into chaos. We saw transport, energy and water networks affected. This led to widespread travel disruption and the closure of schools, offices and shops. Winter was then followed by the hottest summer on record.
Predicting future weather events
It’s impossible to predict exactly how severe a weather event will be and the associated impacts. But there are things we can do to assess the likelihood of them recurring so that people and businesses are better prepared.
At the Met Office we use a variety of modelling techniques. From numerical models that predict the weather a few days ahead to climate projection models that look decades into the future. We combine these outputs with those from other forecast centres, giving us a reliable picture of when to push out public weather warnings. After the event, we look at the observation data (temperatures, rainfalls, windspeeds, etc). We then compare it with historic records to put the severity of the weather that occurred into context.
What is Extreme Value Analysis?
Extreme Value Analysis (EVA) is a statistical technique that enables us to predict the likelihood of extreme values appearing in a data set.
For example, an exceptionally cold spell in place of expected weather. The technique helps us to characterise the risk of any given natural hazard. In practical terms, this helps ensure that infrastructures are built to withstand their impact.
Quantifying the impact of natural hazards
Different infrastructure assets have different operational thresholds, depending on materials and usage. For example, some assets may not be able to function beyond a certain temperature variable: if it gets too hot or too cold, it will fail. The characterisation of an extreme event will vary depending on the asset.
The operational threshold of an asset is often referred to as a ‘return level’ of the weather variable, associated with a ‘return period’. For example, nuclear power infrastructure must be built to withstand an extreme temperature return level event, with a 1-in-10,000-year return period.
In other words, this refers to a high temperature that is expected to occur on average once every 10,000 years. Which equates to a 0.01% probability of that temperature occurring in a given year. So this is the figure we use to ensure that the asset is built to withstand the temperature without failing.
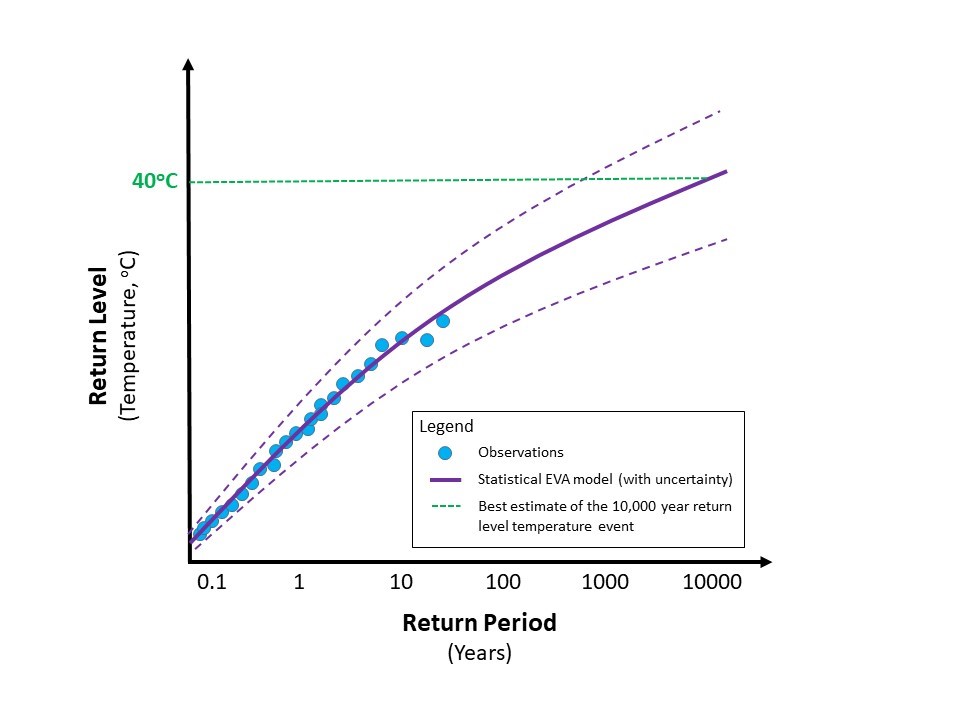
At any given site we’ll have a limited amount of collected data – say, 50 years of observations. But if we’re interested in an extreme event (likely to happen only once every 10,000 years, for example), we need to extrapolate the 50-year data beyond the limits of what we’ve seen historically.
Ideally, we’d draw on thousands of years of weather observations for our future predictions. But for most sites, we have less than 60 years of data. Running observational equipment can be expensive so, instead, we use supercomputers to run climate models. These models can then be used to generate simulations of weather over a prolonged period.
Of course, there’s inherent uncertainty in extrapolated data. Observed data also naturally varies year by year. So a larger initial data set will always yield more accurate predictions. But by extending the data set, we have much greater scope to estimate the probability of history repeating itself. As well as estimating the probability of a new extreme weather event occurring.
How historical data impacts predictions
Observed data gives us a baseline to work from. We can see recent trends that help identify what to look for in the overall data. Take global temperatures, for example. We’ll have a simple metric of overall temperature changing over time. Sometimes that’s down to normal variability, and other times it’s more likely to be due to climate change. If we can isolate these from each other, we can make better predictions for the variable that we’re interested in. This could be temperatures at a specific location for example.
Sticking with the global temperature example, we know that temperatures are rising and that a warmer atmosphere can hold more moisture. This means there’s greater potential for more intense extreme rainfall events in future climates. But these events are likely to be less frequent because it takes longer for the moisture to build back up in the atmosphere. If we can predict global mean temperature, it will impact the predictions we make for mean rainfall in the future. It’s not just historical data of single weather phenomena that we use for our predictions. They’re often interlinked to take into account things like carbon emissions, and climate change.
The basis for infrastructure design
EVA is used to inform the design criteria for large infrastructure projects. It also helps ensure that existing assets meet the current ISO standards and legal requirements for health and safety.
If a bridge is being built, it has to be sensitive to environmental elements such as strong winds. The more powerful the winds, the more robust the bridge needs to be.
It’s not efficient to constantly fix and rebuild structures. The design must take into account extreme events that we expect to occur in an extended time frame.
For any new infrastructure that’s likely to be around for many decades, we need to account for predicted weather events and also for the future climate and how it might affect them.
This, in turn, informs the design criteria of the asset.
Safety in uncertainty
We have recently been involved with a customer from the nuclear industry who is interested in estimating extreme temperatures for a new power station. More specifically, the outside air temperature and how they can keep their buildings cool.
Large air conditioning units are expensive to buy and run – tens of millions of pounds in some cases. Design decisions must account for how hot the outside temperature is likely to get, and how it’s likely to change in future.
Following guidance from the Office for Nuclear Regulation (ONR), the design is initially given a conservative prediction of temperatures. Then, by extrapolating the data set, we can better simulate future temperatures. This results in a much smaller metric of uncertainty for extreme temperature events, which improves trust in the data. The health and safety case is then supported, as well as the design basis for the asset.
Harnessing the value
Our ultimate goal is to provide the best possible weather information, regardless of the metric of uncertainty. When we use model data, we always combine it with observational data in one way or another, so that the model recreates reality.
Our experience of working on critical infrastructure projects has given us vital insight into engineers’ requirements when creating a design basis for an asset. By working collaboratively with engineers in a project’s early stages, we can then maximise the delivery of our science and research. This results in the potential to create significant cost savings across the lifecycle of the asset.
Insights
The latest insights and information from our industry experts
View hub ![]()
Get in touch
Call us
We are available 24/7.
0370 900 0100Email us
Fill out this short form and we'll get back to you.
Contact Us formFollow us
Linkedin XGet in touch
Call us
We are available 24/7.
0370 900 0100Email us
Fill out this short form and we'll get back to you.
Contact Us form