Briefing on Arctic and Antarctic sea ice - August 2019
The Arctic and Antarctic sea ice briefing for August 2019, by Emma Fiedler, Alex West and Ed Blockley.
Summary
- Arctic sea ice extent is the second-lowest on record for the time of year, and very close to the record low of 2012. This follows warm weather and rapid ice melt, particularly at the start of July.
- Following a relatively mild winter and a warm spring, Arctic sea ice extent has been at very low levels since the end of March.
- Predictions of September sea ice extent submitted to the Sea Ice Outlook, and statistical projections using up-to-date daily ice extent data, suggest that this year is likely to witness relatively severe sea ice melt.
- It is therefore likely that September 2019 will see one of the lowest Arctic sea ice extents in the satellite record and the chance of a record low is higher this year than it has been in the last few years. However, the eventual September ice extent will be strongly influenced by weather conditions over the next few weeks.
- Antarctic sea ice extent is currently seventh lowest on record for the time of year.
Current Arctic sea ice extent
Arctic sea ice extent on 11th August 2019 was 5.11 million square km according to data from the US National Snow and Ice Data Center (NSIDC). This is the second-lowest value for this date on record, 2.30 million square km below the 1981-2010 average, and only 0.09 million square km above the lowest value for this date, which occurred in 2012 (Figure 1).
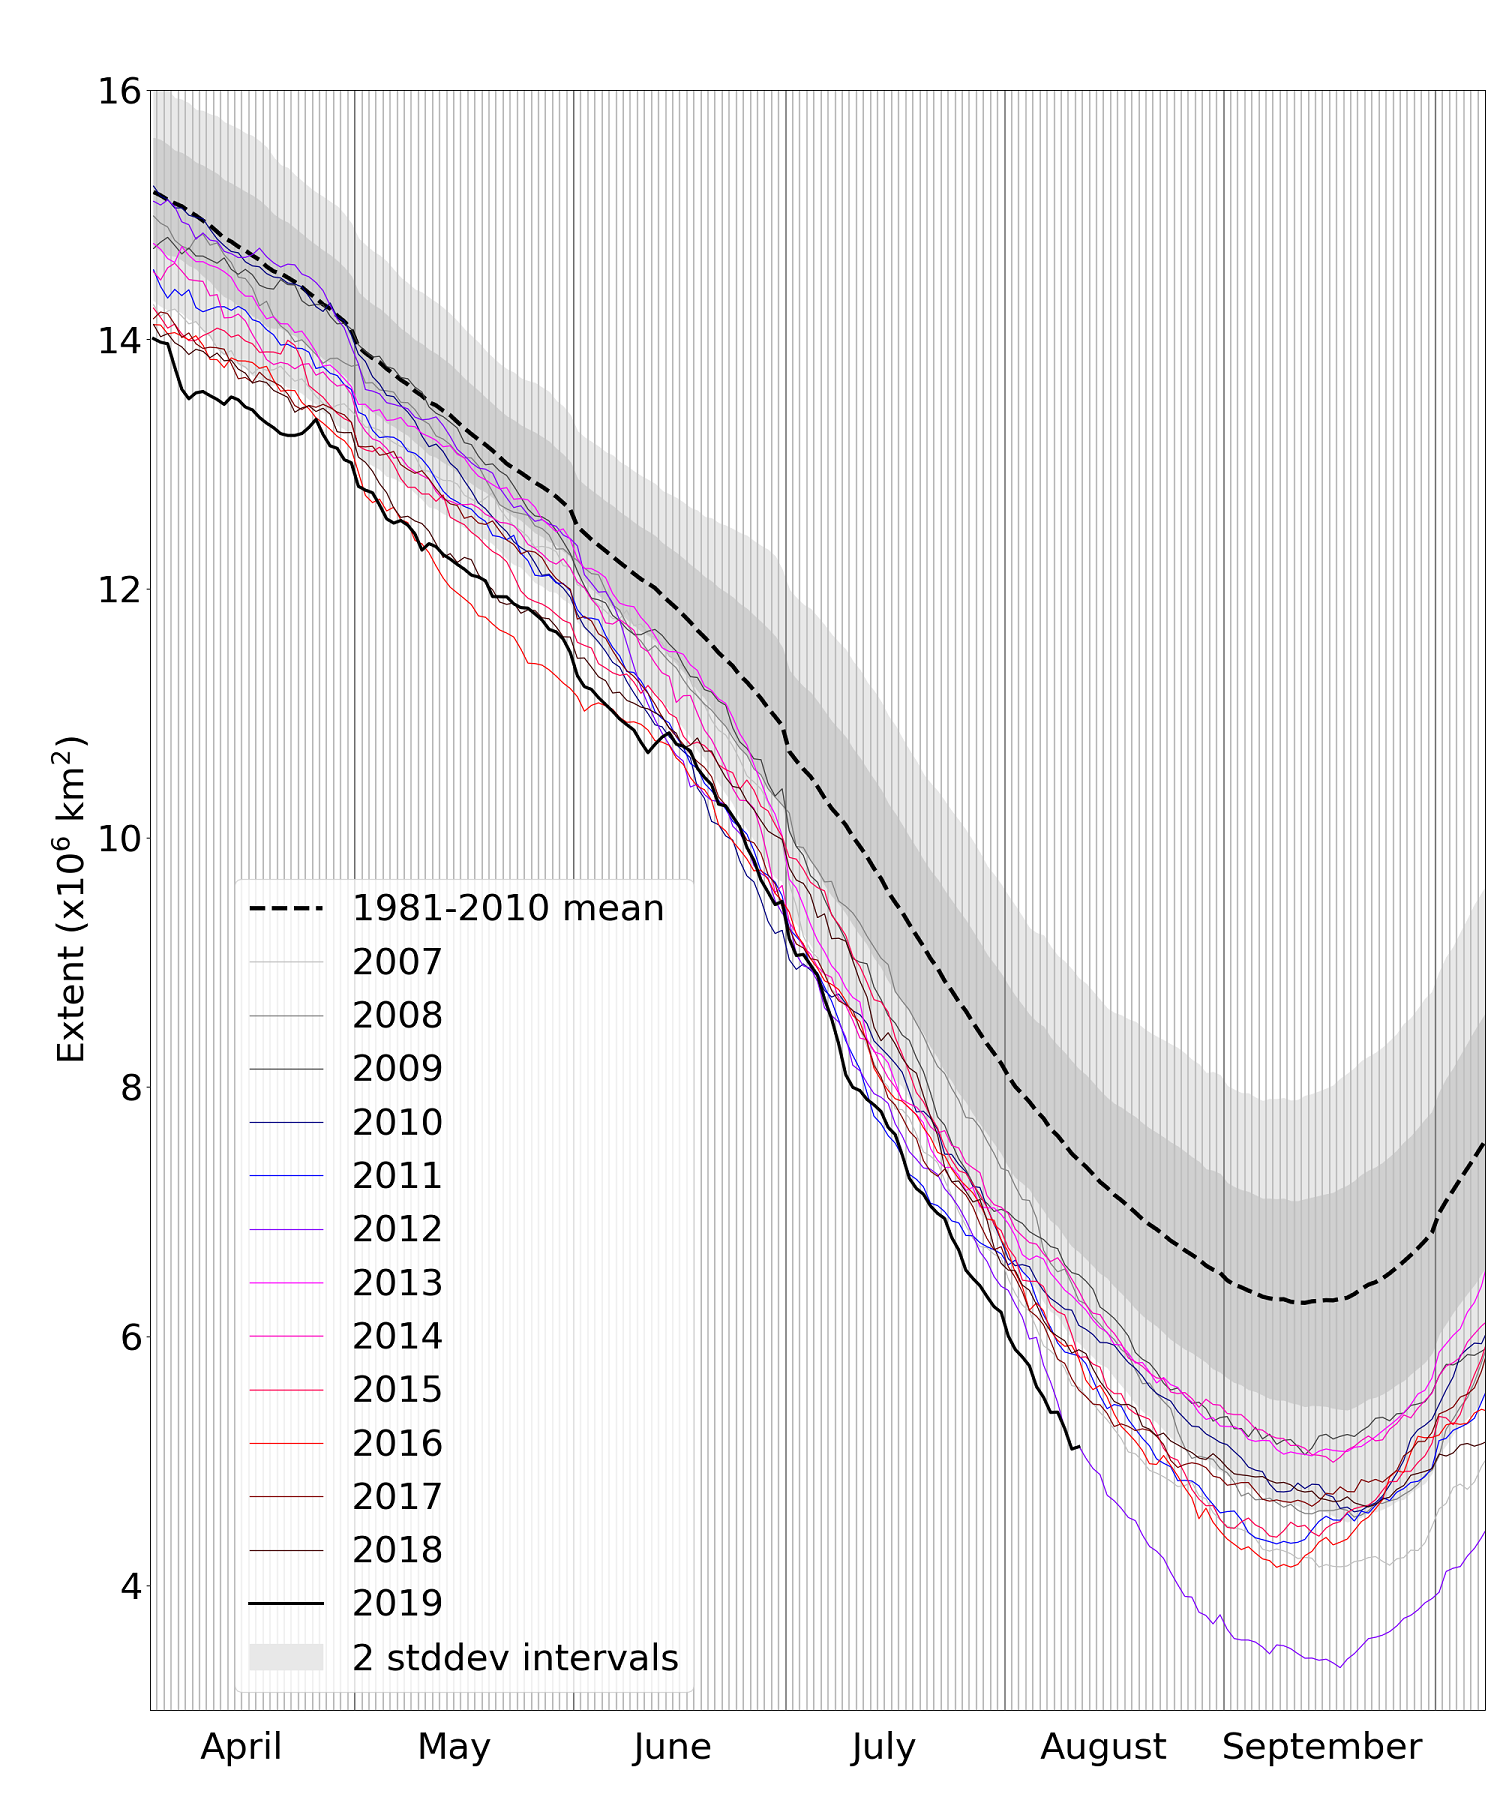
Figure 1. Daily Arctic sea ice extent since April 2019, compared with recent years and the 1981-2010 average with ± 1 and 2 standard deviation intervals indicated by the shaded areas. Data are from the National Snow and Ice Data Center (NSIDC).
Sea ice extent is exceptionally low in the Arctic, particularly in the Beaufort and Chukchi Seas north of Alaska, and the Laptev and Kara Seas (Figure 2). Low concentrations in the East Siberian Sea mean this region is vulnerable to melt further, and any detached areas of ice are likely to melt completely by September. However, the extent is close to the long-term average in the Atlantic Sector.
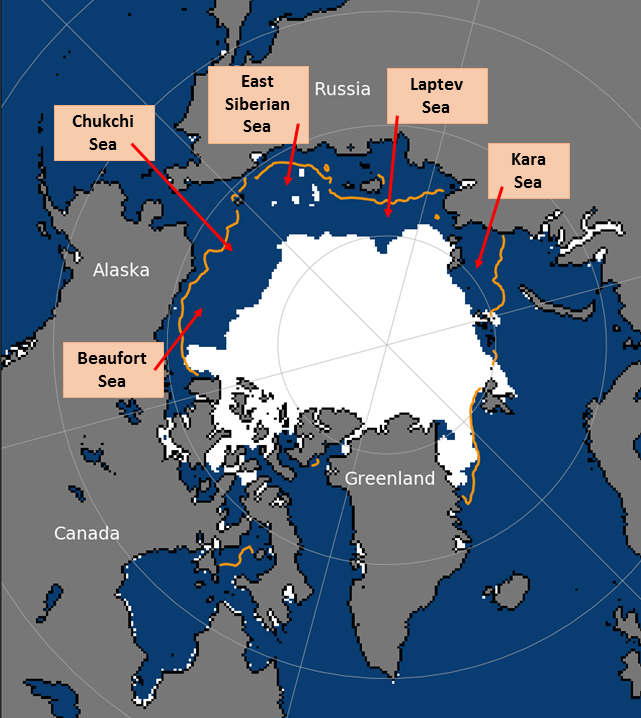
Figure 2. Arctic sea ice extent on 11th August 2019, with 1981-2010 average extent indicated in orange, and the regions referred to in the text labelled. Underlying map and data courtesy of NSIDC.
July 2019 in context
Average sea ice extent for the month of July 2019 was 7.45 million square km, according to the HadISST1.2 dataset (Rayner et al., 2003). This is the lowest July extent on record (the next lowest was 7.56 in 2011), 2.03 million square km below the 1981-2010 average, and 0.34 million square km below the long-term linear trend (Figure 3).
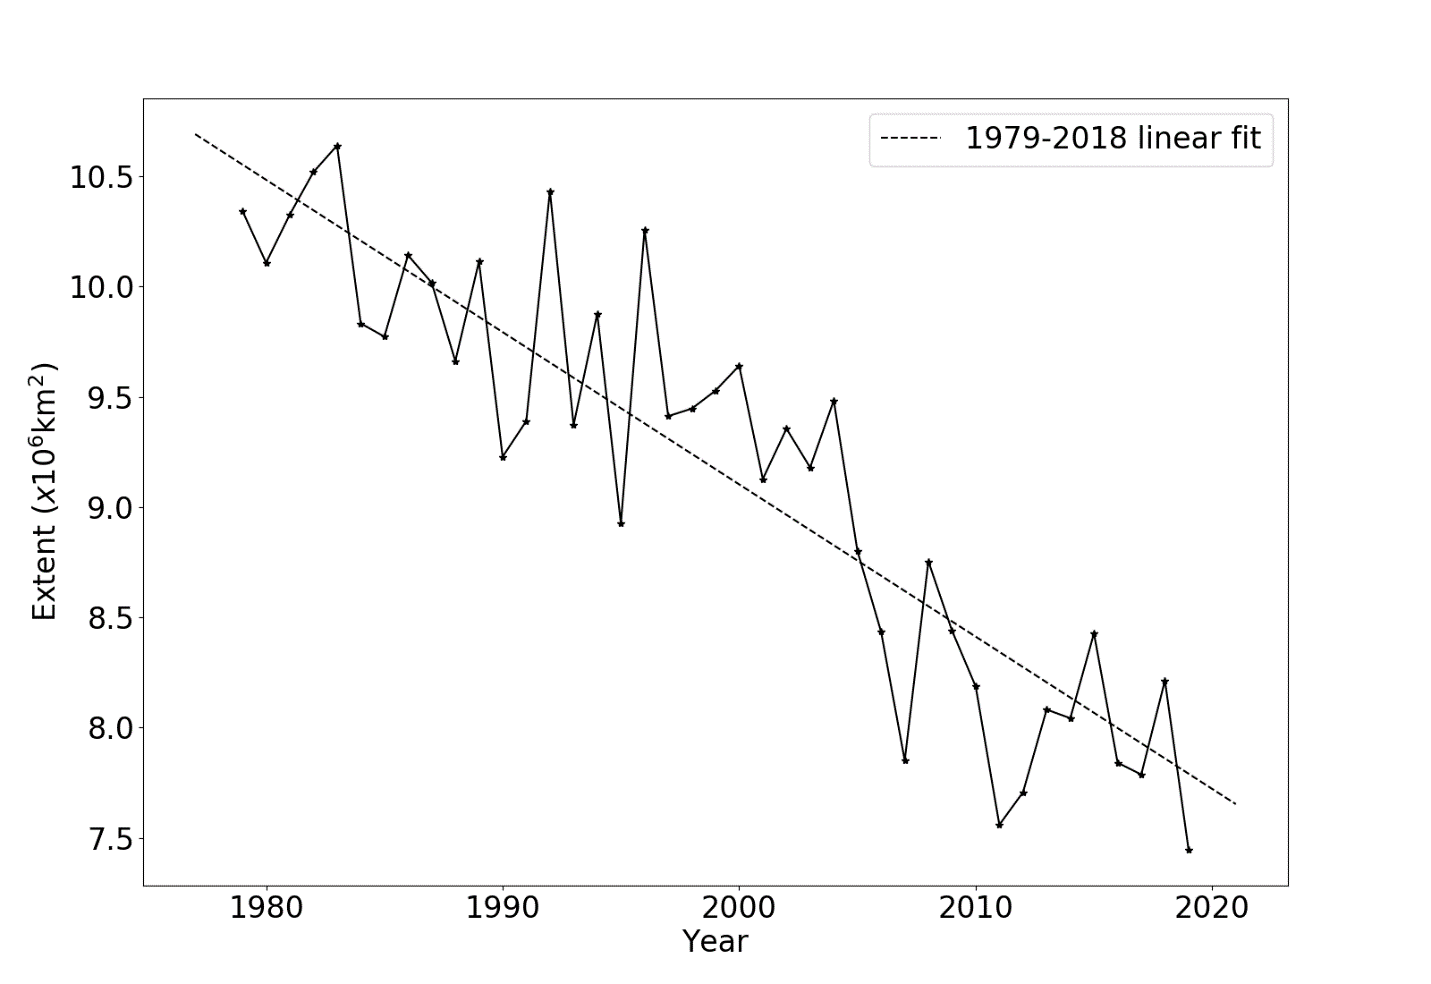
Figure 3. Average July Arctic sea ice extent, according to the Hadley Centre Sea Ice and Sea Surface Temperature (HadISST) 1.2 dataset (Rayner et al., 2003).
The average rate of sea ice loss during July was 105,000 square km per day according to data from NSIDC, well above the 1981-2010 average of 86,000 square km per day, and the 3rd highest rate observed in the satellite era.
The beginning of July was dominated by anticyclonic conditions over the Arctic (Figure 4a) and settled weather. This was associated with warm air temperature anomalies (Figure 4c), particularly in the East Siberian Sea (see Figure 2) where the wind direction was predominantly southerly, leading to rapid ice melt (Figure 1). The middle part of the month was dominated by cyclonic (low pressure) conditions (Figure 4b) over the Beaufort, Chukchi and East Siberian Seas. This may have led to the significant ice loss seen here, due to strong winds breaking up and/or transporting sea ice away from the area. In the latter part of July a return to anticyclonic conditions was seen, leading to continued ice melt and the subsequent record low ice extents for this time of year.
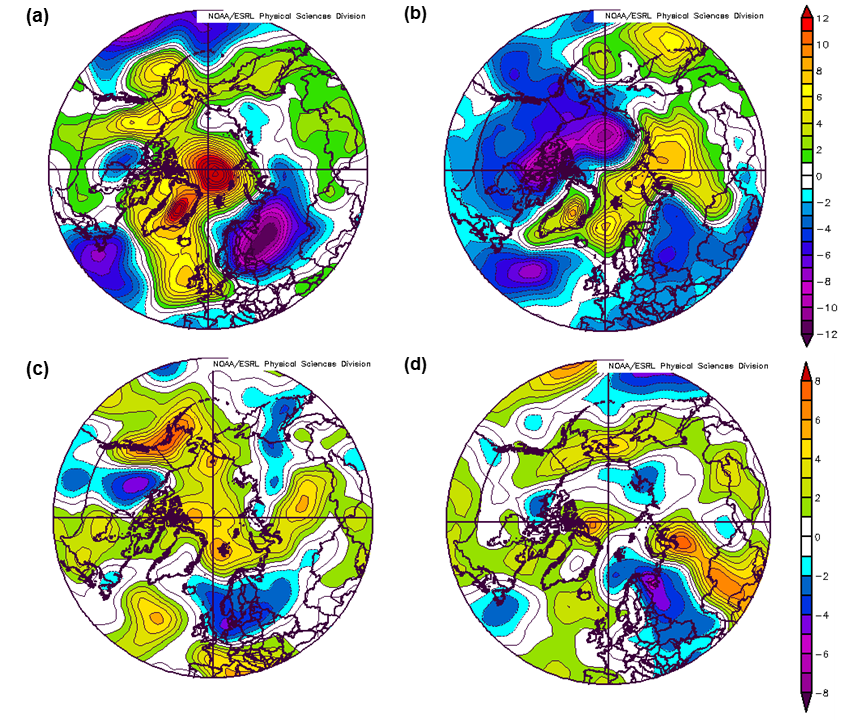
Figure 4. (a) Mean sea level pressure anomaly 1-10 July 2019; (b) Mean sea level pressure anomaly 11-20 July 2019; (c) air temperature anomaly at 925mb 1-10 July 2019; (d) air temperature anomaly at 925mb 11-20 July 2019, all relative to the 1981-2010 average. Data are from the NCEP reanalysis.
Outlook for September
A number of predictions of this year’s seasonal Arctic minimum (September) ice extent is displayed in Figure 5 and described below:
- The Sea Ice Prediction Network (SIPN) July Sea Ice Outlook (SIO) report includes 39 predictions of mean September ice extent based on a variety of methods and from centres around the world. The predictions range from 3.06 to 5.896 million square km, with a median of 4.28 million square km and an interquartile range of 4.0 to 4.6 million square km. One prediction indicates a record low September extent, and one prediction indicates an extent equal to the current record, of 3.6 million square km, in 2012.
- Statistical predictions based on an extrapolation of the linear trend for the entire satellite period from 1979-2018 (black), and most recent 15 years (red) suggest a mean September sea ice extent of 4.36 (±1.07) and 4.30 (± 1.08) million square km respectively.
- There is a high correlation between mean September ice extent and the extent for 28th July – 11th August 2019 (the most recent 15 days of data available at the time of writing). Applying simple statistical methods to the anomalies for these dates gives a prediction of September mean extent of 3.86 (± 0.53) million square km, indicated in blue in Figure 5.
Although the July SIO predictions suggest that a new record low September ice extent this year is unlikely, there remains a high degree of uncertainty for September forecasts made from July. Meanwhile, the statistical predictions, for which the lowest end of the uncertainty ranges are below the 2012 value of 3.6 million square km, suggest that a record September low ice extent is a possibility. While the September minimum extent will be heavily dependent on the Arctic weather conditions over the rest of the month, the chance of a record low is higher this year than it has been in the previous few years.
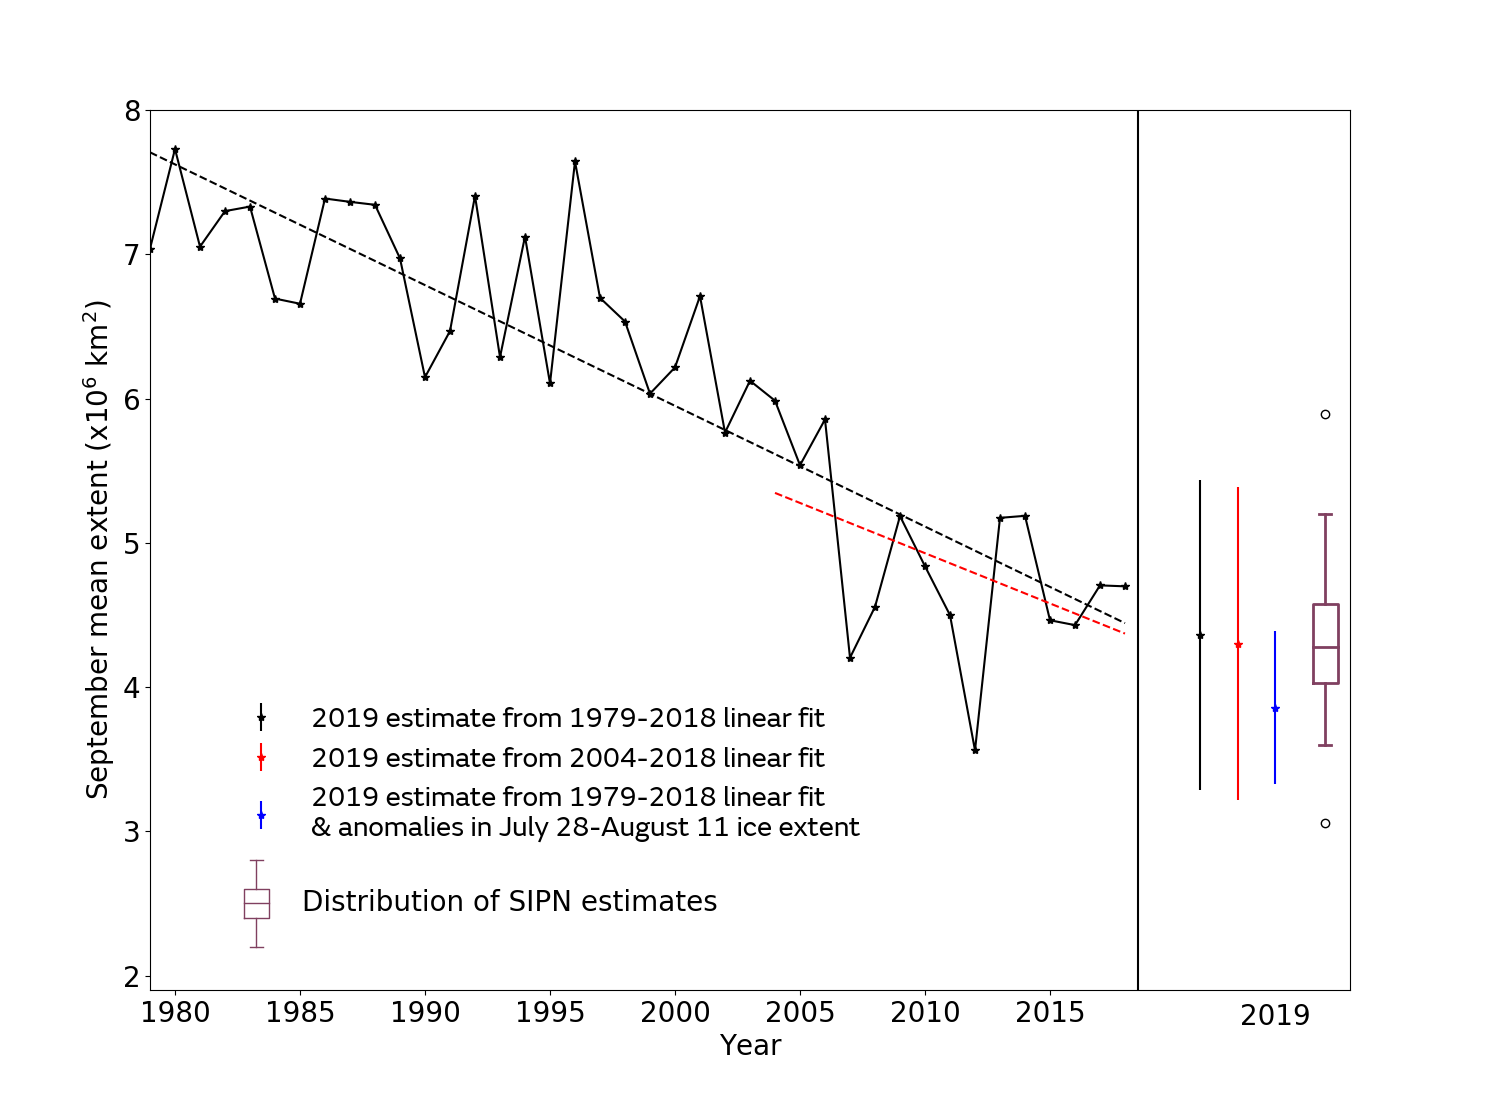
Figure 5: September median Arctic sea ice extent since satellite records began in 1979 from the HadISST1.2 dataset (Rayner et al., 2003), with predictions from the SIPN Sea Ice Outlook and statistical predictions for September 2019. For the statistical predictions, error bars represent twice the standard deviation of September mean ice extent about the trend lines with respect to which the estimates are taken. The Sea Ice Outlook is shown as a boxplot indicating the range, median and quartiles of the 39 predictions submitted. Values more than 1.5 interquartile ranges from the first and third quartiles are shown as outliers.
Antarctic sea ice state
Antarctic sea ice extent on 11th August was 17.24 million square km (Figure 6). This is the 7th lowest value for this date on record, 0.31 million square km below the 1981-2010 average, and 0.58 million square km above the lowest value for this date, which occurred in 1986. Extent is below average in the Ross Sea, Indian Ocean sector and Amundsen Sea (Figure 7). The ice extent has recovered in the Bellingshausen Sea following the low extent highlighted in the July report.
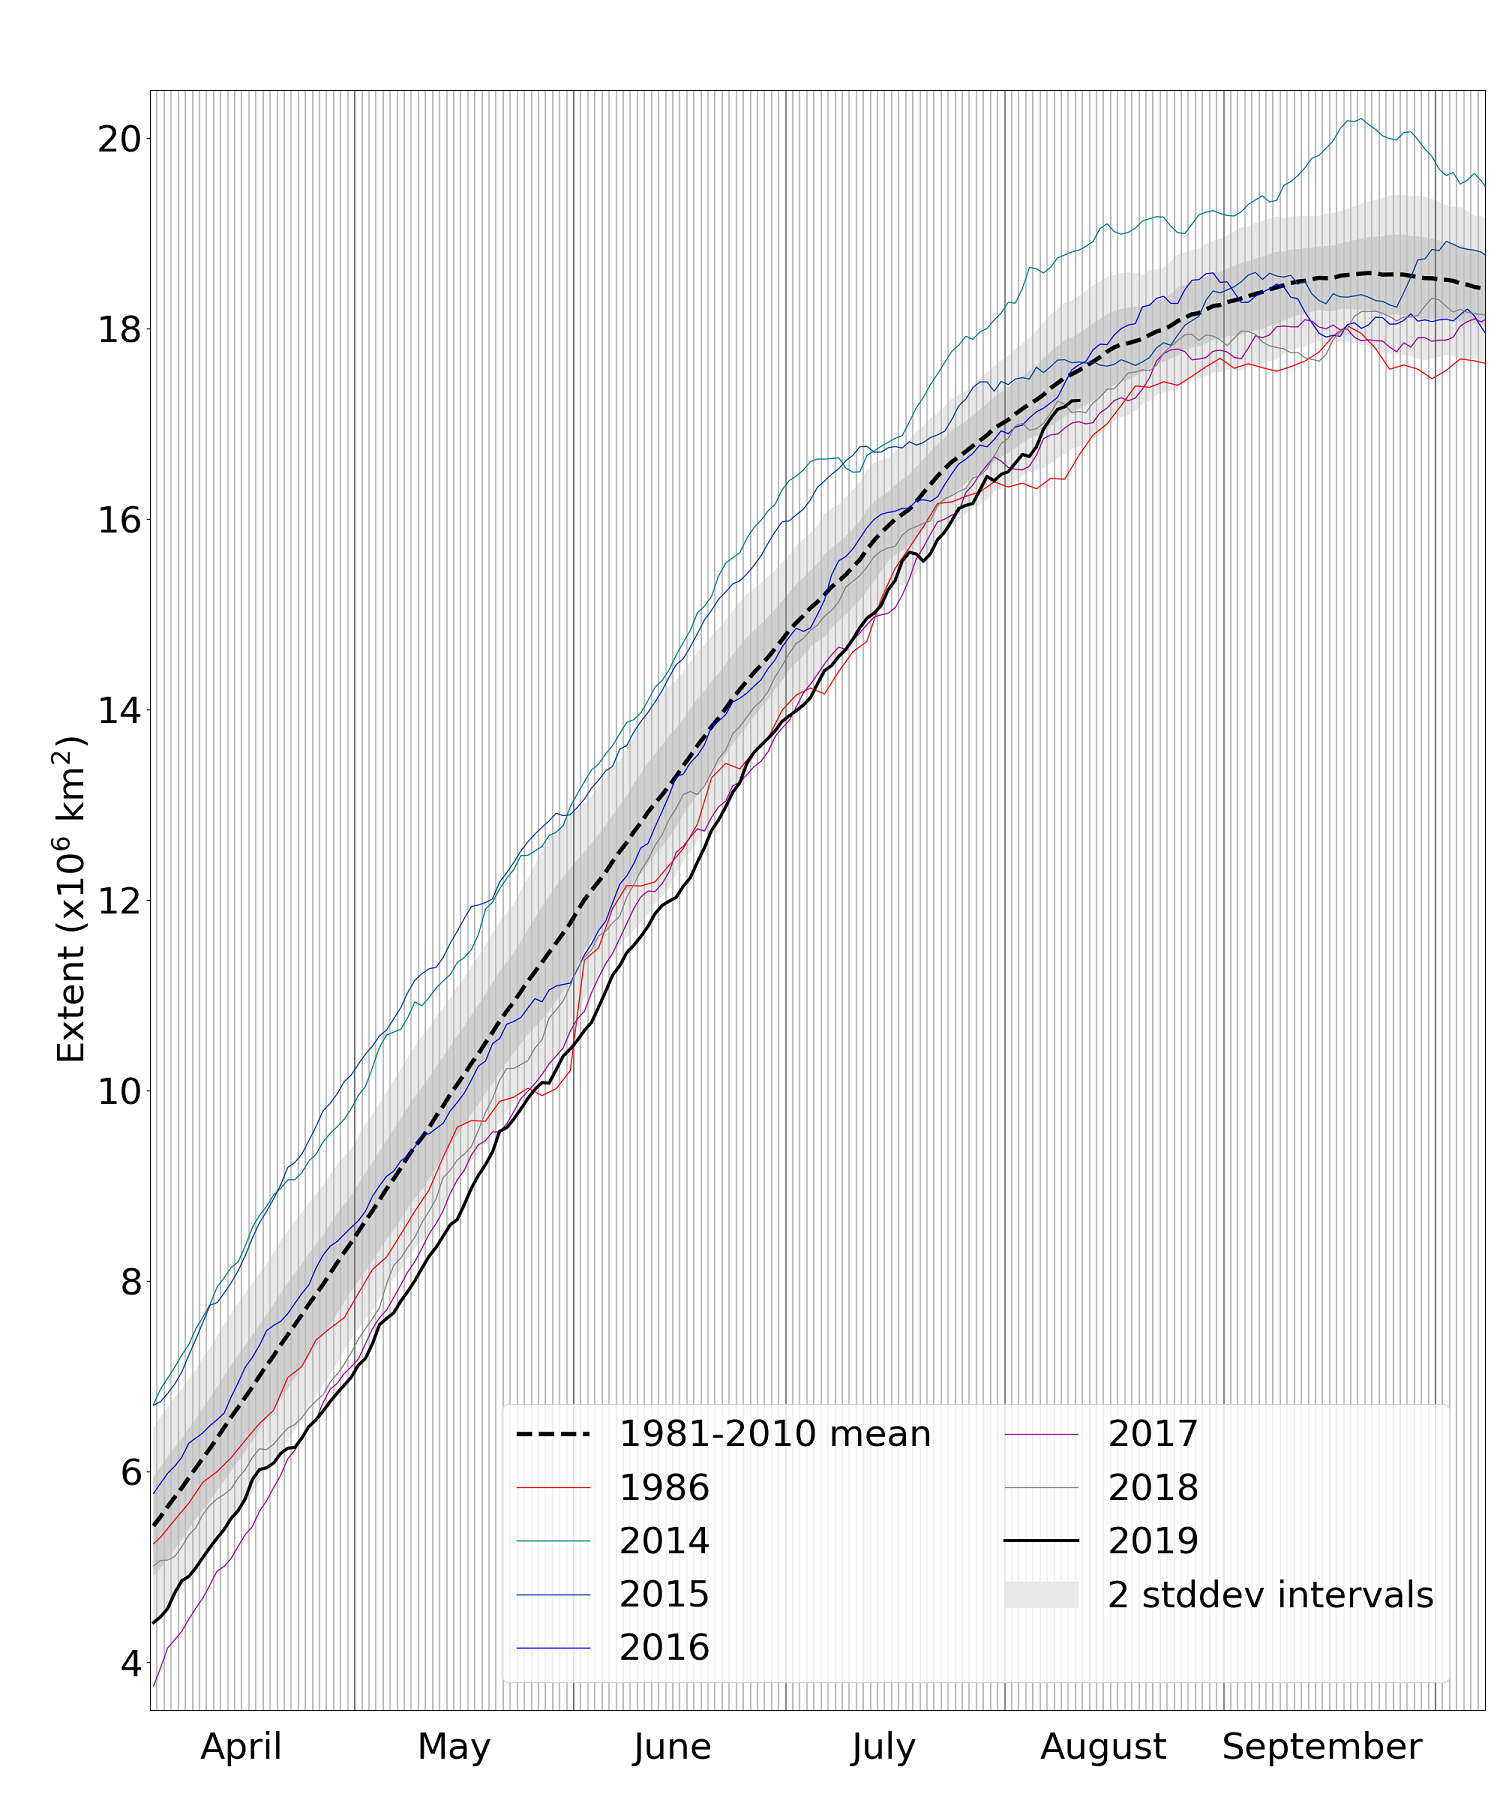
Figure 6. Daily Antarctic sea ice extent for 2019, compared with recent years, the low-ice year of 1986, and the 1981-2010 average, with ± 1 and 2 standard deviation intervals indicated by the shaded areas. Data are from NSIDC.
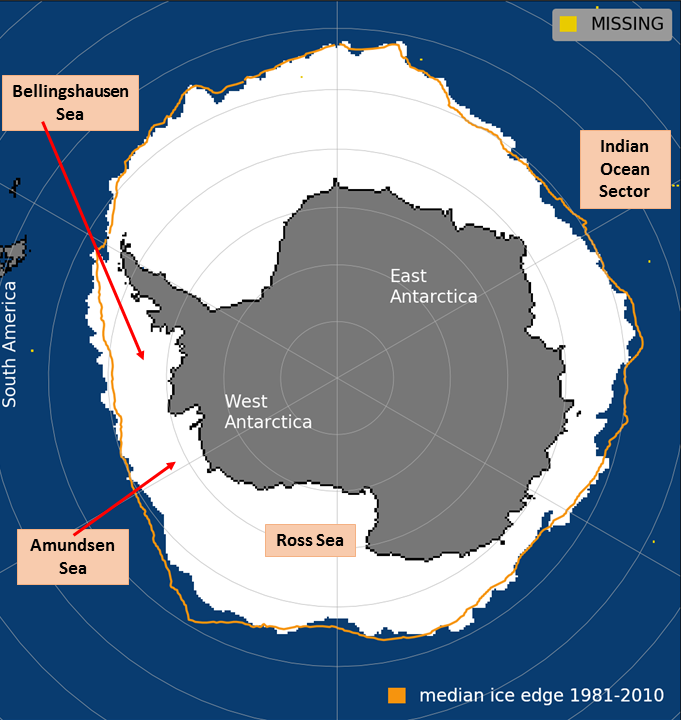
Figure 7. Antarctic sea ice extent on 11th August 2019, with 1981-2010 average extent indicated in orange, and regions referred to in the text labelled. Underlying map and data courtesy of NSIDC.
References
Rayner, N. A.; Parker, D. E.; Horton, E. B.; Folland, C. K.; Alexander, L. V.; Rowell, D. P.; Kent, E. C. and Kaplan, A.: Global analyses of sea surface temperature, sea ice, and night marine air temperature since the late nineteenth century. J. Geophys. Res. Vol. 108, No. D14, 4407 10.1029/2002JD002670, 2003.