Sea ice in the climate system
Arctic sea ice is a sensitive indicator of climate change and changes to the sea ice cover can have potential implications for the Arctic region and beyond.
Sea ice is frozen seawater which floats on the surface of the ocean. It is formed in high latitude regions where there is little or no sunlight in the winter and so atmospheric conditions are cold enough for the ocean to freeze. Sea ice is an important component of the climate system because it regulates the transfer of heat and momentum between the atmosphere and the ocean. It also provides a barrier to the exchange of freshwater, gases and aerosols (tiny, airborne solid and liquid particles). Sea ice is also a major component of polar ecosystems because plants and animals at all levels of the food chain live in or around sea ice. As sea ice is formed from frozen seawater and floats on the sea surface, melting of the ice does not contribute to sea level rise (unlike for melting glaciers and ice sheets which are stores of frozen water on land that add water to the ocean when they melt).
Characteristics of sea ice
The amount of sea ice present in the Arctic (and Antarctic) changes throughout the year as a consequence of the solar heating the polar regions receive. They see little or no sunlight during their winters and almost continuous daylight through their summers. As the Earth's surface at the poles warms in summer more than half the sea ice melts to reveal the open ocean below. Then, as the surface cools in the autumn, the ocean starts to freeze again leading to an increased sea ice cover through the winter months. At least 15% of the ocean is covered by sea ice at some point during the year. Sea ice overview on the composition and behaviour of sea ice is available.
Importance of sea ice in the climate system
The ocean is able to retain heat from the Sun more efficiently than the atmosphere (the ocean has a higher 'heat capacity'). This increased 'memory' of heat means that the seasonal cycle of the ocean is roughly three months behind that of the atmosphere. Ocean-atmosphere interactions therefore generally serve to dampen the seasonal cycle; the oceans delay the cooling of the atmosphere in the autumn and, conversely, delay the warming of the atmosphere in the spring.
The presence of sea ice near the poles changes this relationship. In the winter when solar heating is at a minimum and air temperatures are lowest, the sea ice insulates the ocean from losing heat to the atmosphere above. Conversely, during summer months, the sea ice has a cooling effect as it prevents the ocean from absorbing as much heat from solar radiation or from the atmosphere. In particular the sea ice has a higher reflectivity (or 'albedo') than the ocean which causes more of the sun's rays to be reflected back into space rather than being absorbed by the Earth's climate. The presence of snow on top of the sea ice exaggerates both the insulating and the reflecting effects of sea ice.
Because sea ice is formed from seawater it contains salt which is mostly limited to small pockets of concentrated brine. As the ice grows this brine drains out of the ice which increases the salinity, or salt content, of the surrounding seawater. Likewise when sea ice melts freshwater is released, which lowers the salinity of the surrounding seawater. Salinity is one of the most important factors determining the density structure of seawater. This means changes in salinity caused by sea ice growth/melt can have a considerable impact upon the oceans. The impact can be a local effect such as increased mixing within the near-surface of the ocean or more wide-reaching, such as modification of the basin-scale circulation of the Arctic Ocean or changes to the Atlantic Ocean through the thermohaline circulation (part of the large-scale ocean circulation which is driven by global water density gradients). The Global Ocean Circulation is partly responsible for the UK being warmer than other regions at the same latitude, such as Ontario in Canada.
Arctic sea ice in a warming climate
Even small changes in the atmosphere and ocean can dramatically alter the yearly cycle of sea ice melt and growth, meaning that sea ice changes are representative of the cumulative changes taking place in both the ocean and atmosphere. Therefore, as well as being an important component of the climate system, sea ice can be considered a measure, or a 'barometer', for climate change in the polar regions and further afield. However Arctic sea ice is more than just a sensitive indicator of climate change; sea ice changes can have potential implications for the Arctic region and beyond. Although climatic melting of the Arctic ice can affect many other parts of the climate system, there is still some uncertainty about how these changes will influence the climate further afield, and this area remains the subject of ongoing research. For example, reduction in Arctic sea ice extent has been linked with changes in the jet stream or the North Atlantic Oscillation - both of which play a role in determining winter conditions in the UK and Western Europe. Changes to the seasonal cycle of Arctic sea ice can also affect the salinity and density of the surrounding ocean which can have wider impacts for large-scale ocean circulation.
Presently, around one third of the winter Arctic sea ice remains frozen throughout the summer to become 'multi-year ice'. This summertime ice cover plays an important role in the climate system because it helps regulate the uptake of heat by the Arctic Ocean by reflecting the Sun's rays.
The Earth's climate is warming. One mechanism that can enhance the decline in sea ice in a warming climate is called the 'ice-albedo feedback'. This feedback loop begins with melting of the sea ice due to increased atmospheric and oceanic temperatures. The melting of the ice reveals the ocean surface below. The ocean is much darker than the more reflective ice which means that the albedo (or reflectivity) of the Arctic surface is reduced, resulting in higher absorption of solar radiation. The increased solar heating causes more ice to melt which, in turn, exposes more of the darker ocean surface, and increases solar absorption still further. The ice-albedo feedback is strongest during the summer when solar radiation is at its highest. The mechanism is shown schematically in Figure 1.
Ice albedo feedback

Figure 1: Schematic showing the ice albedo feedback which can lead to amplification of warming in the Arctic.
When quantifying the amount of sea ice present at either pole, scientists normally use a measure known as sea ice 'extent' which is defined to be the total area of ocean that contains sea ice with concentration above 15%. As well as sea ice extent, knowledge of the total volume/mass of sea ice present is important for understanding the climate system. The mass of sea ice at any particular moment is dependent on the area of ice and its thickness. Melt and growth of the ice is termed the 'ice mass balance'; negative mass balance implies a decreasing sea ice cover whilst a positive mass balance results in net growth. Long-term changes to the ice mass balance are important indicators of climate change.
Observed changes to Arctic sea ice
Improved understanding and systematic monitoring of Earth's climate requires observations of various atmospheric, oceanic and terrestrial components. In order to make these measurements researchers rely on various technologies which can be broadly grouped into two distinct areas: on location (in-situ) measurements and remote sensing (namely satellite) techniques. Over the last few decades new observational systems, in particular satellite platforms, have considerably increased the number of climate observations available to researchers. These measurements are made by a diverse set of scientists across the world, who use different technologies to gather climate data and understand their uncertainties. These observations and understanding provide the evidence on the broad extent of the changing climate throughout our planet. Like many other parts of the Earth's climate, monitoring of Arctic sea ice makes use of numerous observational datasets using both in-situ and remote sensing methods. A brief description of How we measure sea ice relevant to sea ice is available.
Arctic sea ice extent decline
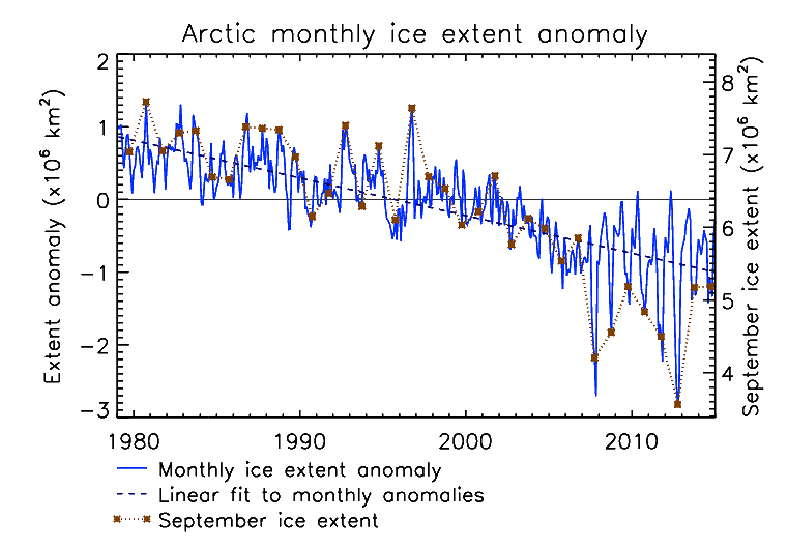
Figure 2: Arctic sea ice extent decline: observations of monthly extent anomaly (difference from the 1981-2010 average) in blue (left axis). Actual sea ice extent for September is also shown in red (right axis).
Observations from satellites and in-situ measurements show a trend of significant reduction in the extent and volume of Arctic sea ice. As there is a lot of year-to-year variability in the weather, the mass balance in the Arctic tends to fluctuate from one year to the next and so an unusually warm summer can cause the ice to melt more than usual (negative mass balance) and, likewise, a particularly cold summer (or winter) can cause the sea ice to grow (positive mass balance). As well as the weather the thickness and extent of the sea ice at the start of the melt season and the heat content of the ocean have an impact on the mass balance in a particular year. It is the combination of these conditions that cause the sea ice extent to be so variable from year to year. This means that long periods of continuous observations are used to identify trends in sea ice.
The most dramatic indicator of a changing Arctic climate in recent years has been the summer minimum extent of Arctic sea ice as observed from space. Recent years have seen dramatic changes in the state of the Arctic sea ice cover and the last nine years (2007-2015) have seen the nine lowest summer sea ice extents in the continuous satellite record, which extends back to 1979. The downward trend in Arctic sea ice extent from 1979 to 2014 is depicted in Figure 2, which shows monthly anomalies in sea ice extent (the difference relative to the 1981-2010 average for each month) calculated from satellite measurements. The anomalies vary from year to year, with some extreme highs (1997) and lows (2007, 2012). Fitting a linear trend to the monthly anomalies, a straight line through the monthly values as shown by the blue dashed line in the figure, gives a mean decrease of approximately 4.4% per decade over this period. It is not just the summer sea ice that has been declining; the Arctic has seen a reduction in sea ice extent throughout the year. Figure 3 shows the decadal changes in the seasonal cycle of Arctic sea ice extent since 1979.
Changes to the seasonal cycle of Arctic sea ice cover
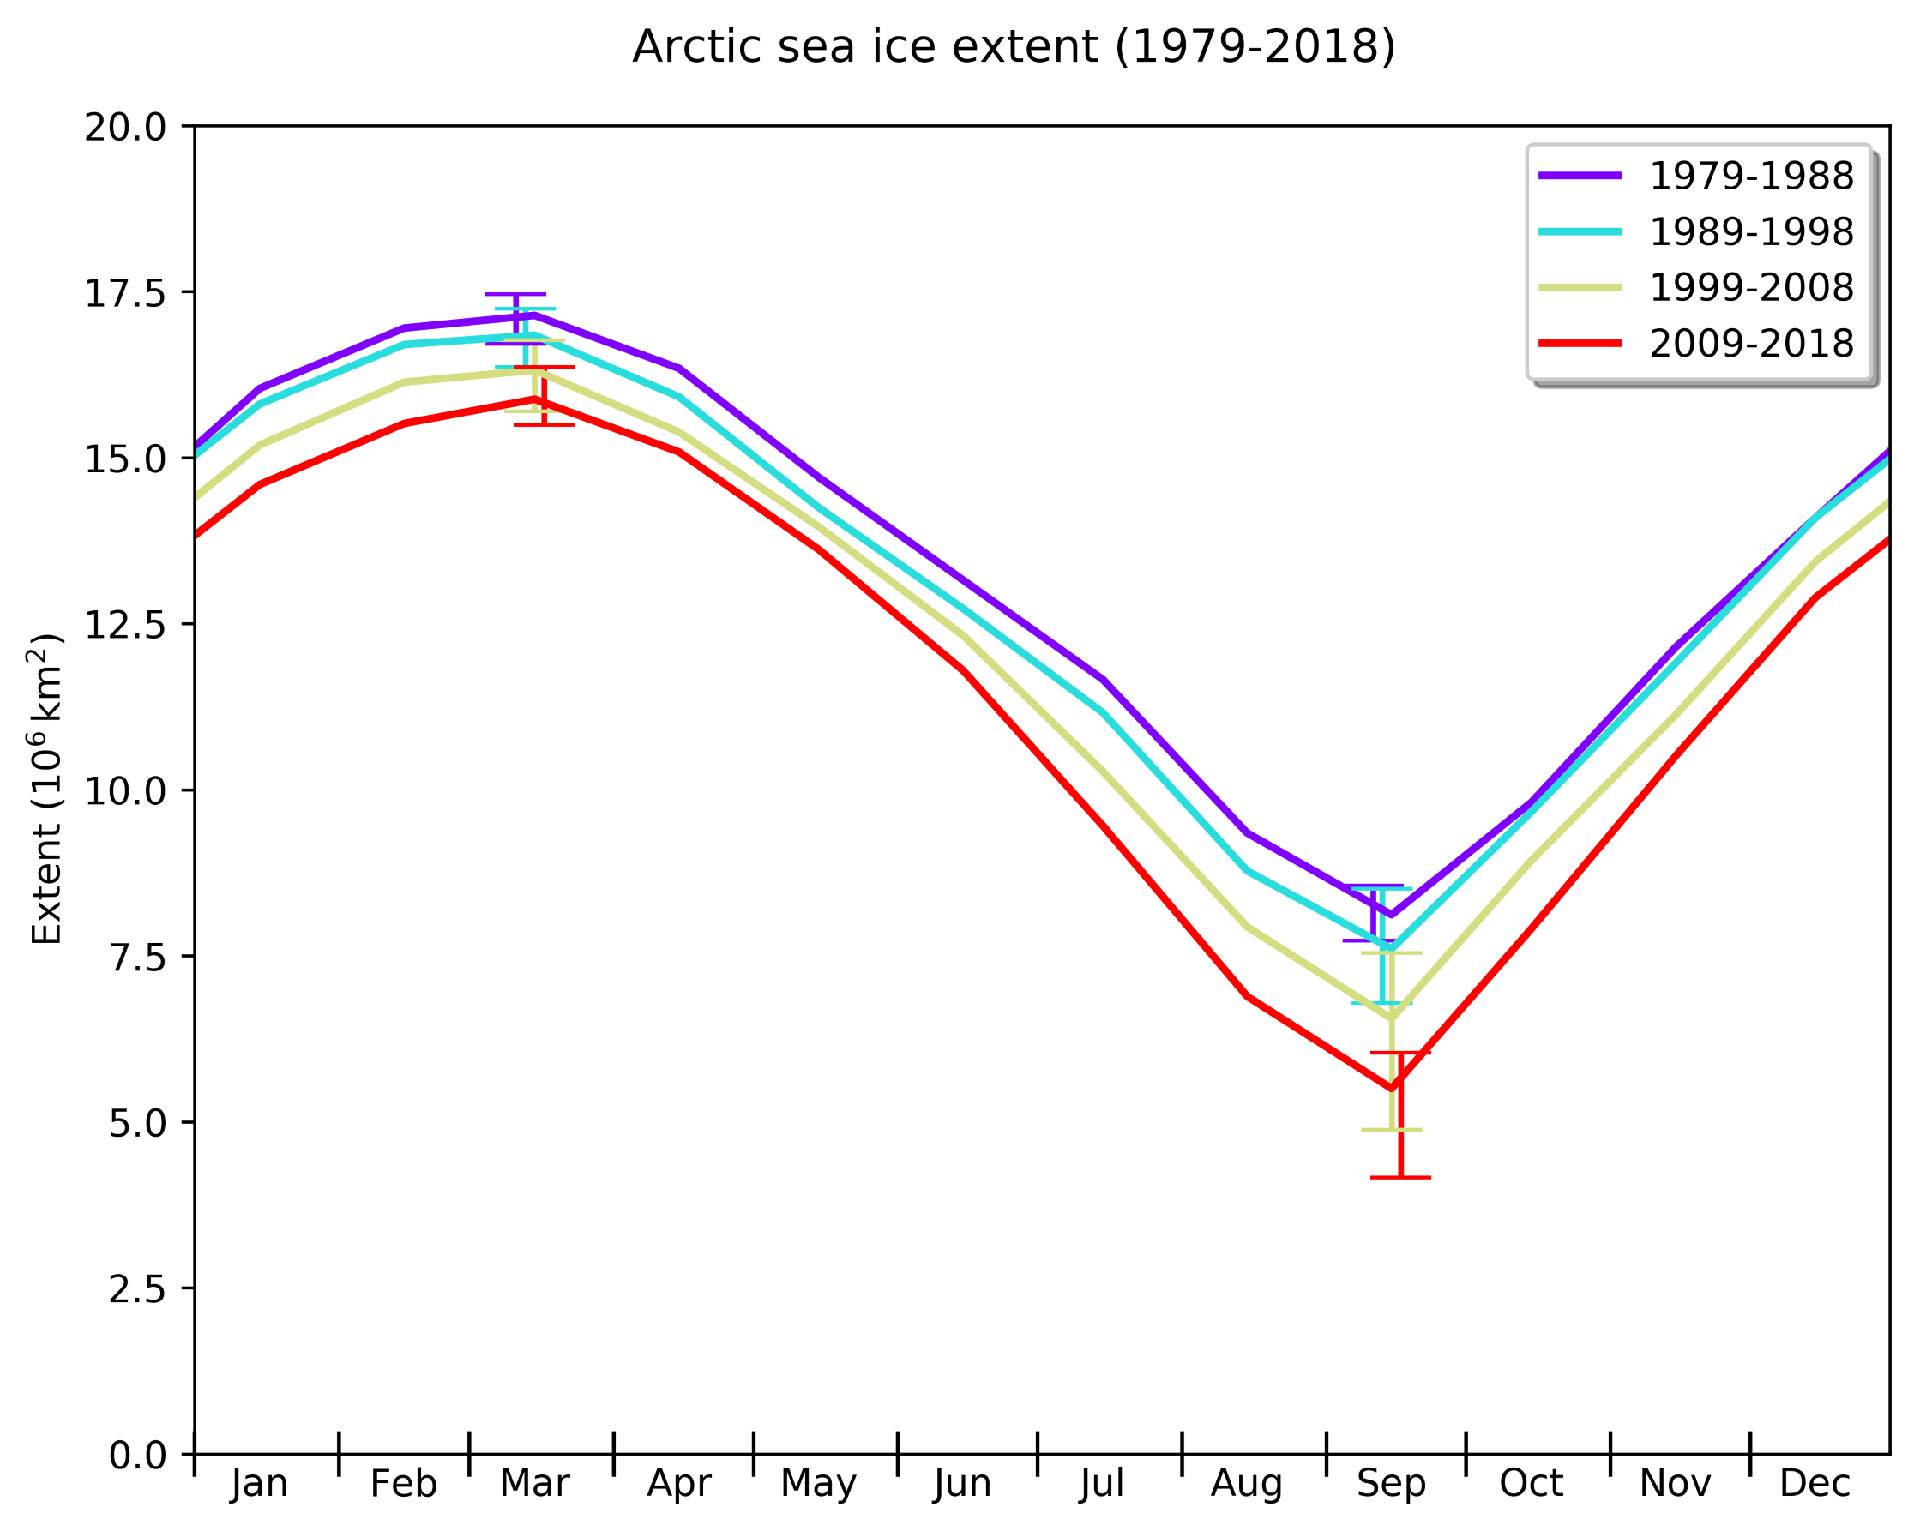
Figure 3: Changes to the seasonal cycle of Arctic sea ice cover shown using decadal averages of daily extent. Data are from Met Office Hadley Centre HadISST dataset
The decline in summer sea ice extent of course means the amount of ice that survives through to the following winter to become multi-year ice, is also declining. This can be seen in the upper half of Figure 4 which shows, through time (left) and in terms of space (right), the observed decline in multi-year ice at the start of each year (January 1st). The loss of thick multi-year ice means that the average thickness of Arctic sea ice is decreasing overall. A combination of satellite and submarine data has been used to estimate a decrease of average ice thickness in the central Arctic from 3.64m to 1.89m over the period 1980 to 2008 which gives an approximate average rate of thinning of 60cm per decade. This is shown in the lower half of Figure 4 which shows, through time (left) and in terms of space (right), the observed Arctic sea ice thinning for various observation sources.
Observed Arctic sea ice decline over the last 3 decades
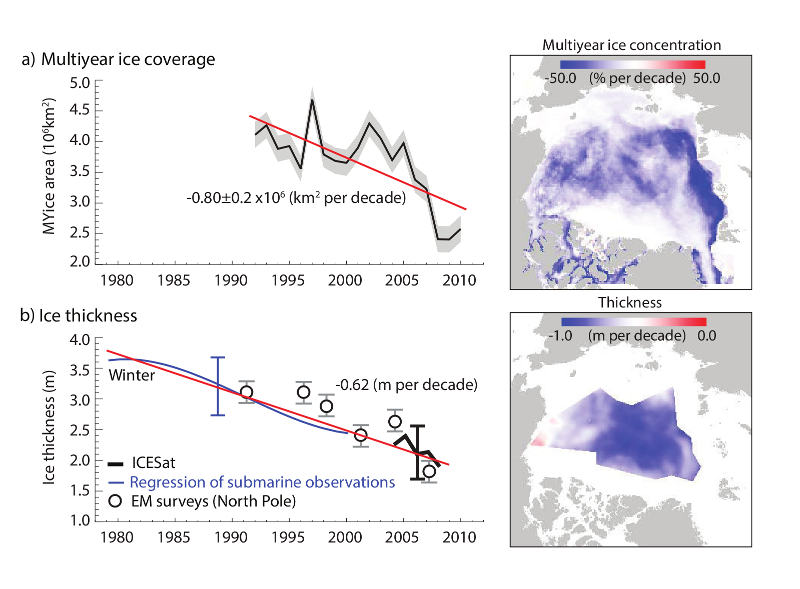
Figure 4: Observed Arctic sea ice decline over the last 3 decades. The top panels show Arctic multi-year sea ice coverage derived using NASA QuickSCAT satellite data and the bottom panels show sea ice thickness from various sources. Left-hand time series plots show evolution over time with decadal trends over plotted in red. The right-hand maps show the spatial distribution of the multi-decadal average trend. (Courtesy of IPCC AR5.)
Future projections of Arctic sea ice
Climate models are the most comprehensive tools available to scientists to investigate the response of the climate system to various factors (such as greenhouse gas concentrations), as they model a wide range of physical processes and feedbacks. They are used for making climate predictions on seasonal to decadal time scales and for making projections of future climate over the coming century and beyond. Climate models are also used to study historical changes in the Earth's climate. Model projections over the historical period are verified against observational data and this gives us confidence that we can use these models to make sensible projections of future climate, including in the Arctic. Climate models are not designed to reproduce the observed sea ice variability for individual years, rather to capture the big picture: the long term trend of the amount of ice. Models are able to produce high and low ice events similar to those observed but we do not expect models to project the exact timings of high and low ice years.
Climate model projections are made following a range of scenarios that each describes a plausible scenario of future atmospheric greenhouse gas concentrations based on various socio-economic factors. For the Intergovernmental Panel on Climate Change (IPCC) Fifth Assessment Report (AR5) these scenarios were described by four Representative Concentration Pathways (RCPs); RCP2.6, RCP4.5, RCP6.0 and RCP8.5. The RCP number is related to the strength of human influences on the climate at the end of the 21st century and the larger numbers are indicative of higher greenhouse gas concentrations. The RCPs used for the IPCC AR5 span the full range of perturbations to the Earth's radiation budget (or 'radiative forcing') associated with emission scenarios published in the peer-reviewed literature at the time. The RCP2.6 scenario is often referred to as an 'aggressive mitigation' scenario because it would require drastic decreases in greenhouse gas emissions to achieve.
Climate models show a downward trend in Arctic sea ice extent through the 21stCentury as the planet warms in response to increasing CO2 concentrations, with the summer minimum of the cycle declining faster than the winter maximum. Figure 5 shows projections of September sea ice extent under the RCP8.5 and RCP2.6 scenarios for a subset of climate models used for the IPCC AR5 with their historical projections shown in grey. The subset was selected based on the models that most closely reproduced the average sea ice seasonal cycle and the observed downward trend in Arctic sea ice from 1979 to 2012.
Projections of September sea ice extent under the RCP8.5 and RCP2.6 greenhouse gas scenarios for a subset of climate models used for the IPCC AR5
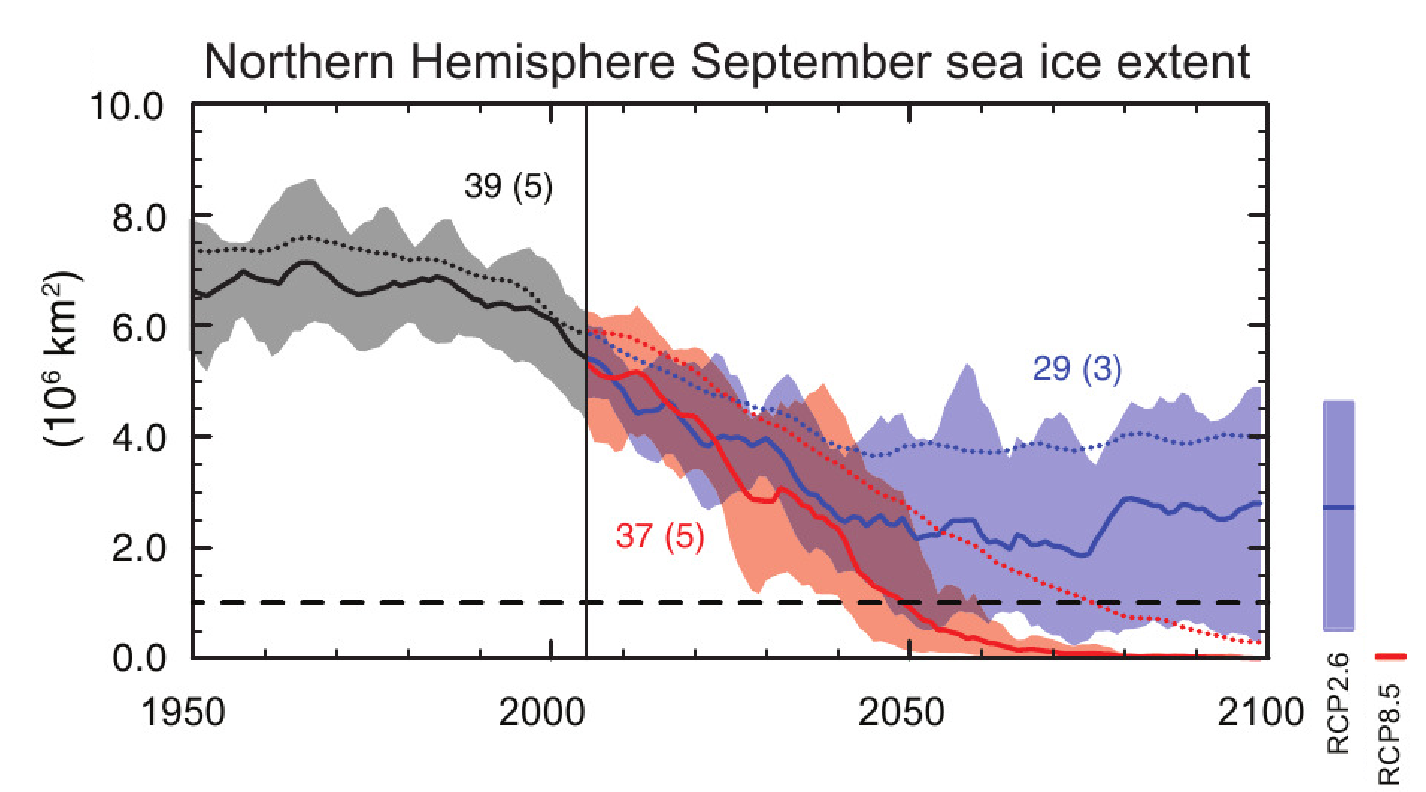
Figure 5: Projections of September sea ice extent under the RCP8.5 and RCP2.6 greenhouse gas scenarios for a subset of climate models used for the IPCC AR5 with historical projections shown in grey. The subset was selected based on the models' representation of the observed downward trend in Arctic sea ice from 1979 to 2012. The mean of the subset is shown as a solid line, with the minimum and maximum range shown as shading. The multi-model mean of the whole ensemble is also shown as a dashed line, and the number of model experiments used is given. (Courtesy of IPCC AR5.)
Figure 6 shows the spatial pattern of September Arctic sea ice extent projected by IPCC AR5 models for the four RCP scenarios over the period 2081-2100. As the Arctic summer sea ice cover decreases, any sea ice left will become increasingly confined to the Canadian archipelago, allowing increased navigability of the Arctic Ocean via the Northern Sea Route (along the northern Siberian coast) and possibly the Northwest Passages (through the Canadian archipelago and along the north Alaskan coast). Therefore in the future there is the potential to see increased shipping and commercial activity in the Arctic motivated by the need to reduce shipping times and costs, and the desire to access natural resources such as oil, gas and mineral reserves in the region
The spatial pattern of September Arctic sea ice extent projected by IPCC AR5 models for the four RCP scenarios over the period 2081-2100
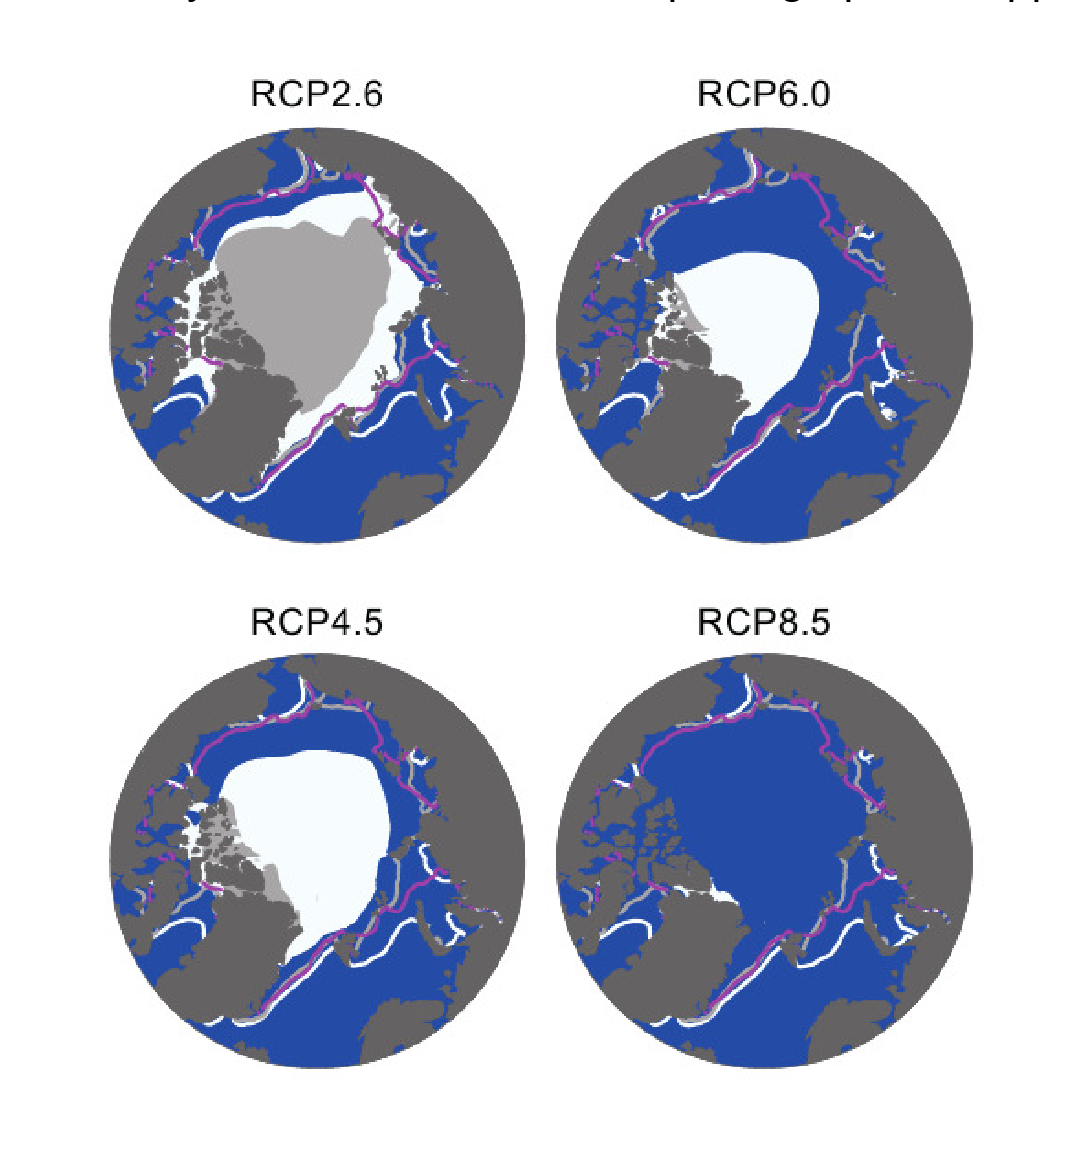
Figure 6: The spatial pattern of September Arctic sea ice extent projected by IPCC AR5 models for the four RCP scenarios over the period 2081-2100. The filled areas show the 2081-2100 average sea ice extent and the lines show the 1986-2005 average (the pink line shows the observations over the same period). The multi-model average extent is shown in white and that from the most realistic subset of models is shown by the light grey. (Courtesy of IPCC AR5.)
In light of the observed decline in Arctic sea ice extent over the last few decades, and the projected continuance of this decline by climate models, the question of when the Arctic will become seasonally ice free has become quite a popular topic. As Arctic sea ice cover decreases, any sea ice that survives through to summer will tend to be bunched up against the north coast of Greenland and the Canadian Arctic archipelago. These areas are relatively resistant to melting and so considerably more climate warming would be required to melt the ice further. Therefore the Arctic is considered to be 'ice-free' when the sea ice extent falls below 1 million square km.
Models vary in their ability to capture recent changes in the Arctic sea ice, but climate projections from models that perform well against observations of past climate show that a plausible earliest date that the Arctic could be seasonally 'ice-free' in a given year is the 2040s, under the RCP8.5 greenhouse gas concentration scenario. Natural year-to-year variability of the ice extent may mean that initially the 'ice-free' threshold would not necessarily be met every year. The IPCC AR5 concludes that a nearly ice-free Arctic Ocean in September for at least 5 consecutive years is likely to happen before the middle of the 21st century.
There have been claims made that that we will see a seasonally ice-free Arctic at some point during the current decade. However these claims are made on the basis of simply extrapolating model output and/or observational records, and so cannot take into account changes in feedbacks and processes in the climate system as the ice cover declines. Therefore climate models remain our most robust tool for investigating future change.
References
Vaughan, D.G., et. al 2013: Observations: Cryosphere. In: Climate Change 2013: The Physical Science Basis. Contribution of Working Group I to the Fifth Assessment Report of the Intergovernmental Panel on Climate Change [Stocker, T.F., D. Qin, G.-K. Plattner, M. Tignor, S.K. Allen, J. Boschung, A. Nauels, Y. Xia, V. Bex and P.M. Midgley (eds.)]. Cambridge University Press, Cambridge, United Kingdom and New York, NY, USA.
Flato, G., et. al 2013: Evaluation of Climate Models. In: Climate Change 2013: The Physical Science Basis. Contribution of Working Group I to the Fifth Assessment Report of the Intergovernmental Panel on Climate Change [Stocker, T.F., D. Qin, G.-K. Plattner, M. Tignor, S.K. Allen, J. Boschung, A. Nauels, Y. Xia, V. Bex and P.M. Midgley (eds.)]. Cambridge University Press, Cambridge, United Kingdom and New York, NY, USA.
Collins, M., et. al 2013: Long-term Climate Change: Projections, Commitments and Irreversibility. In: Climate Change 2013: The Physical Science Basis. Contribution of Working Group I to the Fifth Assessment Report of the Intergovernmental Panel on Climate Change [Stocker, T.F., D. Qin, G.-K. Plattner, M. Tignor, S.K. Allen, J. Boschung, A. Nauels, Y. Xia, V. Bex and P.M. Midgley (eds.)]. Cambridge University Press, Cambridge, United Kingdom and New York, NY, USA.
van Vuuren, D.P., Edmonds, J., Kainuma, M.L.T., Riahi, K., Thomson, A., Matsui, T., Hurtt, G., Lamarque, J.-F., Meinshausen, M., Smith, S., Grainer, C., Rose, S., Hibbard, K.A., Nakicenovic, N., Krey, V., Kram, T. 2011. Representative concentration pathways: An overview. Climatic Change. doi:10.1007/s10584-011-0148-z
Hewitt, H., Bacon, S., Feltham, D., Folland, C., Giles, K., Graham, T., Hawkins, E., Hodson, D., Jackson, L., Keeley, S., Keen, A., Laxon, S., McLaren, A., Menary, M., Palmer, M., Scaife, A., Smith, D., Srokosz, M., West, A., Wood, R. and Schweiger, A., 2012. Hadley Centre Technical Note 91: Assessment of Possibility and Impact of Rapid Climate Change in the Arctic.