Decadal forecast 2019
Outlook for global climate in the coming years
Forecast issued January 2020. The forecast will next be updated in January 2021.
Decadal forecasts, also called ‘near-term’ climate predictions, range up to a decade ahead. Predictions account for natural variability and climate change as these are expected to be of similar size in many parts of the world over this forecast period. Forecasts are experimental, so at this early stage of development expert advice is needed to assess the skill and reliability of regional predictions.
Important
- Long-range forecasts are unlike weather forecasts for the next few days
- Forecasts are for a range of possible conditions over a wide region and time period
Summary
Averaged over the five-year period 2020-2024, forecast patterns suggest enhanced warming over land, and at high northern latitudes. There is some indication of continued cool conditions in the Southern Ocean. Current relatively cool conditions in the north Atlantic sub-polar gyre are predicted to warm, with potentially important climate impacts over Europe, America and Africa.
During the five-year period 2020-2024, global average temperature is expected to remain high and is very likely to be between 1.06°C and 1.62°C above the pre-industrial period from 1850–1900.This compares with an anomaly of +1.16±0.1°C observed in 2016, currently the warmest year on record. In the absence of a major volcanic eruption a new record is likely in the coming five years, and there is a small (~10%) chance of one year temporarily exceeding 1.5°C. These high global temperatures are consistent with continued high levels of greenhouse gases.
Introduction
Decadal forecasts are designed to predict fluctuations in the climate system over the next few years. They take into account natural variability as well as human influences. This is achieved by initialising climate models with observations of the current climate state, in addition to specifying changes in radiative forcing due to greenhouse gases, aerosols (both volcanic and anthropogenic), and solar variability. Further details can be found in a Met Office article about the basis of decadal forecasting.
The latest Met Office decadal forecast presented here was started from the observed sea surface temperature pattern shown in Figure 1, along with similar observations of temperature and salinity below the ocean surface, atmospheric winds, temperatures and surface pressure. The temperatures in Figure 1 show warm conditions in many regions, especially at high northern latitudes, and relatively cool conditions in parts of the Southern Ocean, eastern Pacific and parts of the North Atlantic.
Observed sea surface temperature
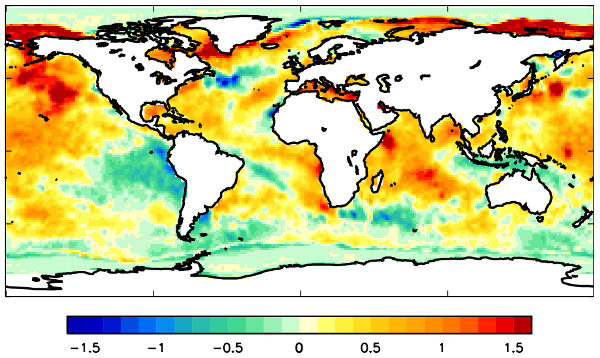
Figure 1: Observed sea surface temperature differences (°C) relative to 1981-2010 for October 2019. These, together with similar observations below the ocean surface, have been used as starting conditions for the decadal forecast.
Forecast
The maps below (Figure 2) show predicted temperatures over the period November 2019–October 2024 relative to 1981-2010 averages. Diagram A shows the most likely forecast outcome. Diagrams B and C indicate the range of forecast temperatures, such that we expect only a 10% chance of temperatures at particular locations being less than those in B, and only a 10% chance of temperatures higher than in C. Note that these ranges are for each individual location. The chances of these limits being met everywhere are very small, so the complete patterns shown in diagrams B and C are very unlikely to be realised.
Five-year mean forecast: mean, lower and upper estimates
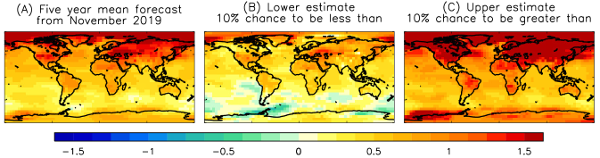
Figure 2: Forecast (A) of surface temperature differences (°C) relative to 1981-2010 for the 5-year period November 2019 to October 2024. Forecasts consist of 10 ensemble members starting from November 2019. The probable range is diagnosed from the ensemble spread, and shown as the lower (B) and upper (C) limits for each 5° grid box, such that there is a 10% chance of the observations being cooler than (B), and a 10% chance of the observations being warmer than (C). Note that the actual anomaly patterns in (B) and (C) are unlikely to occur since extreme fluctuations would not be expected at all locations simultaneously.
Spatial patterns suggest enhanced warming is likely over much of the globe, especially over land and at high northern latitudes. Uncertainties in the forecast are considerable: for the period 2020-2024 most regions are expected to be warmer than the average of 1981 to 2010, but regional cooling is possible – especially over parts of the Southern Ocean. Further forecasts from other international modelling centres are available from the WMO Lead Centre for Annual to Decadal Prediction.
During the five-year period 2020-2024, global average temperature (see blue shading in Figure 3 below) is expected to remain between 1.06°C and 1.62°C (90% confidence range) relative to pre-industrial conditions represented by the period 1850 to 1900 (0.45°C to 1.01°C above the 1981-2010 mean) with a small (~10%) chance of one year temporarily exceeding 1.5°C. The warmest individual year in more than 160 years of Met Office Hadley Centre global temperature data is 2016 with a temperature of 1.16 ± 0.1 °C relative to pre-industrial conditions. In the absence of a major volcanic eruption a new record is likely in the coming five years. Averaged over the whole five-year period 2020-2024, global average temperature is expected to be between 1.15°C and 1.46°C above pre-industrial conditions (0.54°C to 0.85°C above the 1981-2010 mean).
Global annual temperature
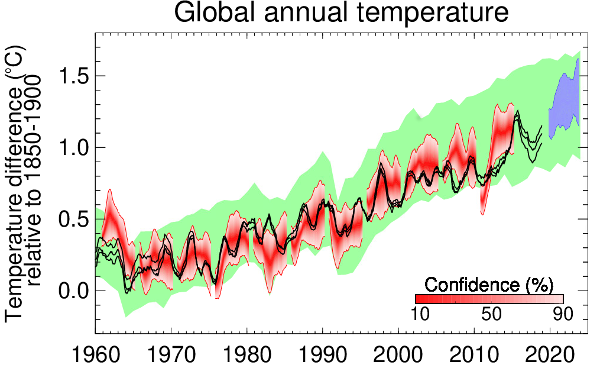
Figure 3: Observed (black, from Met Office Hadley Centre, GISS and NCDC) and predicted (blue) global average annual surface temperature difference relative to pre-industrial conditions represented by the period 1850-1900. Previous predictions at 5-year intervals starting from November 1960 and through to 2010 are shown in red. 22 model simulations, from the Coupled Model Intercomparison Project phase 5 (CMIP5), that have not been initialised with observations are shown in green. In all cases, the shading represents the probable range, such that the observations are expected to lie within the shading 90% of the time. The most recent forecast (blue) starts from November 2019. All data are rolling 12-month mean values. The gap between the black curves and blue shading arises because the last observed value represents the period November 2018 to October 2019 whereas the first forecast period is November 2019 to October 2020.
The forecast is for continued global warming largely driven by continued high levels of greenhouse gases. However, other changes in the climate system, including longer term shifts in both the Pacific Decadal Oscillation (PDO) and Atlantic Multidecadal Oscillation (AMO), are also contributing. Near record temperatures are predicted during the coming five years, consistent with the 2020 Met Office annual global temperature forecast. The forecast remains towards the mid to upper end of the range simulated by CMIP5 models that have not been initialised with observations (green shading in Figure 3). Barring a large volcanic eruption or a very sudden return to negative PDO or AMO conditions (which could temporarily cool climate), ten year global average warming rates are very likely to be similar to late 20th century levels over the next few years.
Verification of previous forecast
The following maps (Figure 4) compare observed (A) and forecast (B, issued in January 2015) surface temperatures (°C) for November 2014 to October 2019 relative to the 1981-2010 long-term average. Forecasts were made starting from November 2014 using the version of our forecast system at the time. Stippling shows regions where the observed temperatures lie outside the 5-95% range of the forecast.
Observations and five-year mean forecast from November 2014
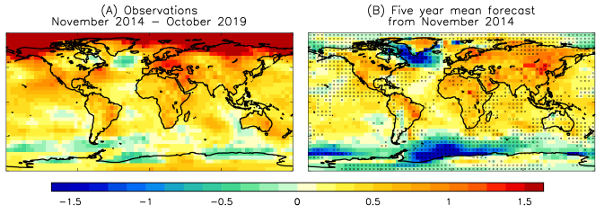
Figure 4: Observed (A) and issued forecast (B) of surface temperature differences (°C) relative to 1981-2010 for the 5-year period November 2014 to October 2019. Forecasts consist of 10 ensemble members starting from November 2014. The stippling shows where the observations lie outside of the 5-95% confidence interval of the forecast ensemble.
The forecast issued five years ago predicted enhanced warming over high northern latitudes, and cooling in parts of the Southern Ocean and the North Atlantic sub-polar gyre. Although there are some differences in the precise magnitude and location of anomalies, the observations generally lie within the forecast uncertainty range. However, the forecast was generally cooler than observed in parts of the Southern Ocean, the North Atlantic sub-polar gyre, the Arctic and the north-east Pacific.