Major update to key global temperature data set
December 2020 - The Met Office and University of East Anglia released a major update to the HadCRUT global temperature data set.
We recently released version 5 of the HadCRUT global temperature data set, produced in a long-running collaboration between the Met Office Hadley Centre and the Climatic Research Unit (CRU) at the University of East Anglia. The data and paper are freely available via our website. The HadCRUT5 data set brings in new data for the land and ocean. We have improved the way that marine instrument changes are dealt with and, for the first time, we use statistical methods to provide an improved analysis that extends the coverage in data sparse areas.
None of these improvements affect the broad scale conclusions. Long-term warming is still clearly evident at a global scale – in line with other data sets – and the four years 2015 to 2018 are the warmest in the series, which at the time of publication runs from 1850 to 2018. However, the overall warming from the start of the record is slightly larger than was estimated from HadCRUT version 4.
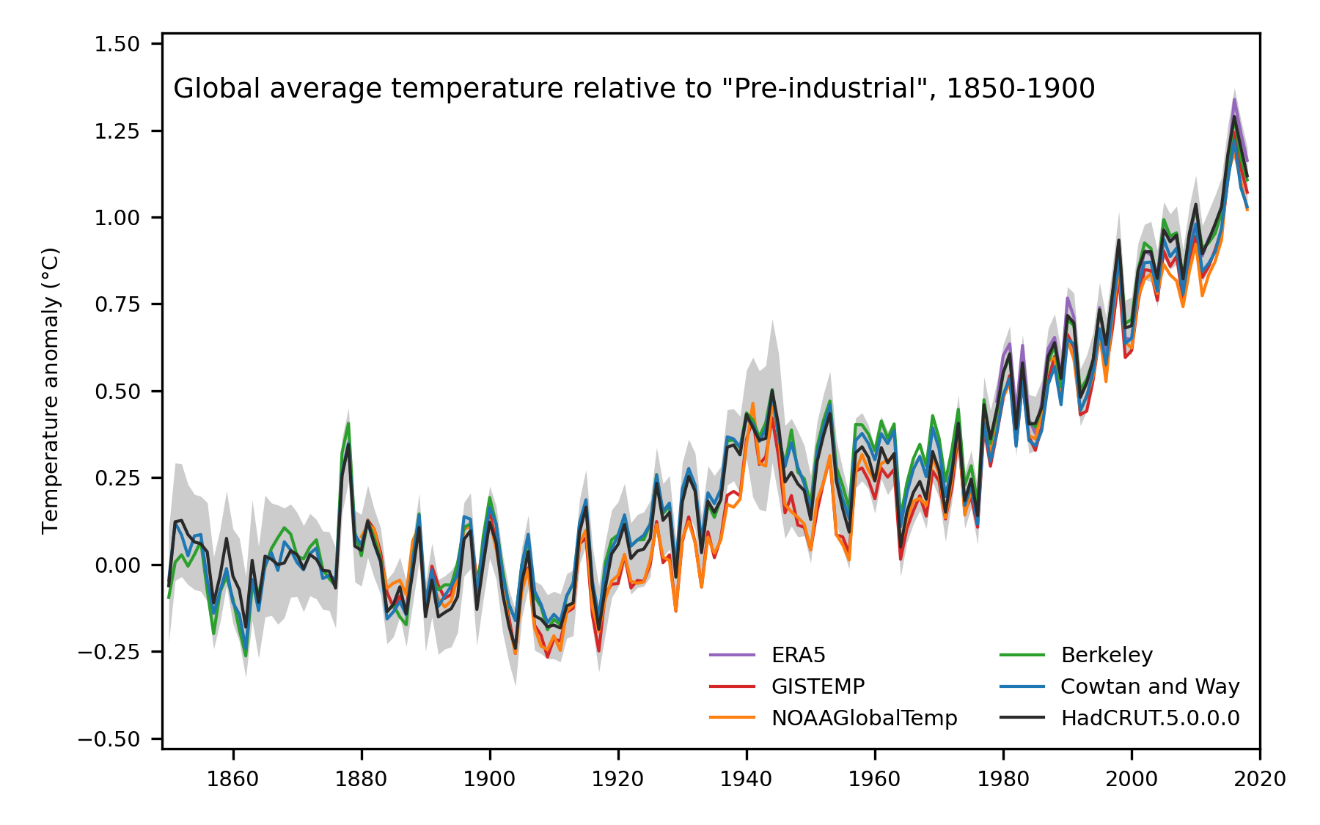
Caption: Global average temperature (°C) relative to the average for 1850-1900, computed from a range of global temperature data sets
The slight increase in estimated long-term warming has two main causes. The first is that we improved how we deal with changes in the way that sea-surface temperatures were measured, using higher-quality measurements as a reference. The second is that increasing the coverage – by drawing on a larger database of observations and using statistical methods – means we get a more balanced estimate of global temperature change.
The improvements to the sea-surface temperature data were published last year. We used data from research cruises and other oceanographic measurements to calculate the offsets between measurement methods and to work out which methods were being used at different times and places. We found that more ships were measuring sea-surface temperature in their engine rooms than was previously thought. Measurements made in the engine room use water drawn in below the surface but tend to report temperatures that are slightly too high due to warming of the water in the pipework and warm environment of the engine room. This artificial warming effect has diminished over time. It has the largest effect around the end of the 1970s when the warm bias and the global fleet were both changing fast.
The data coverage was improved by using larger databases of land and ocean measurements and by using a well-established statistical method to make the most of the measurements that we do have. The land data archive has been added to by CRU. Ocean measurements are taken principally from the latest release of the International Comprehensive Ocean Atmosphere Data Set.
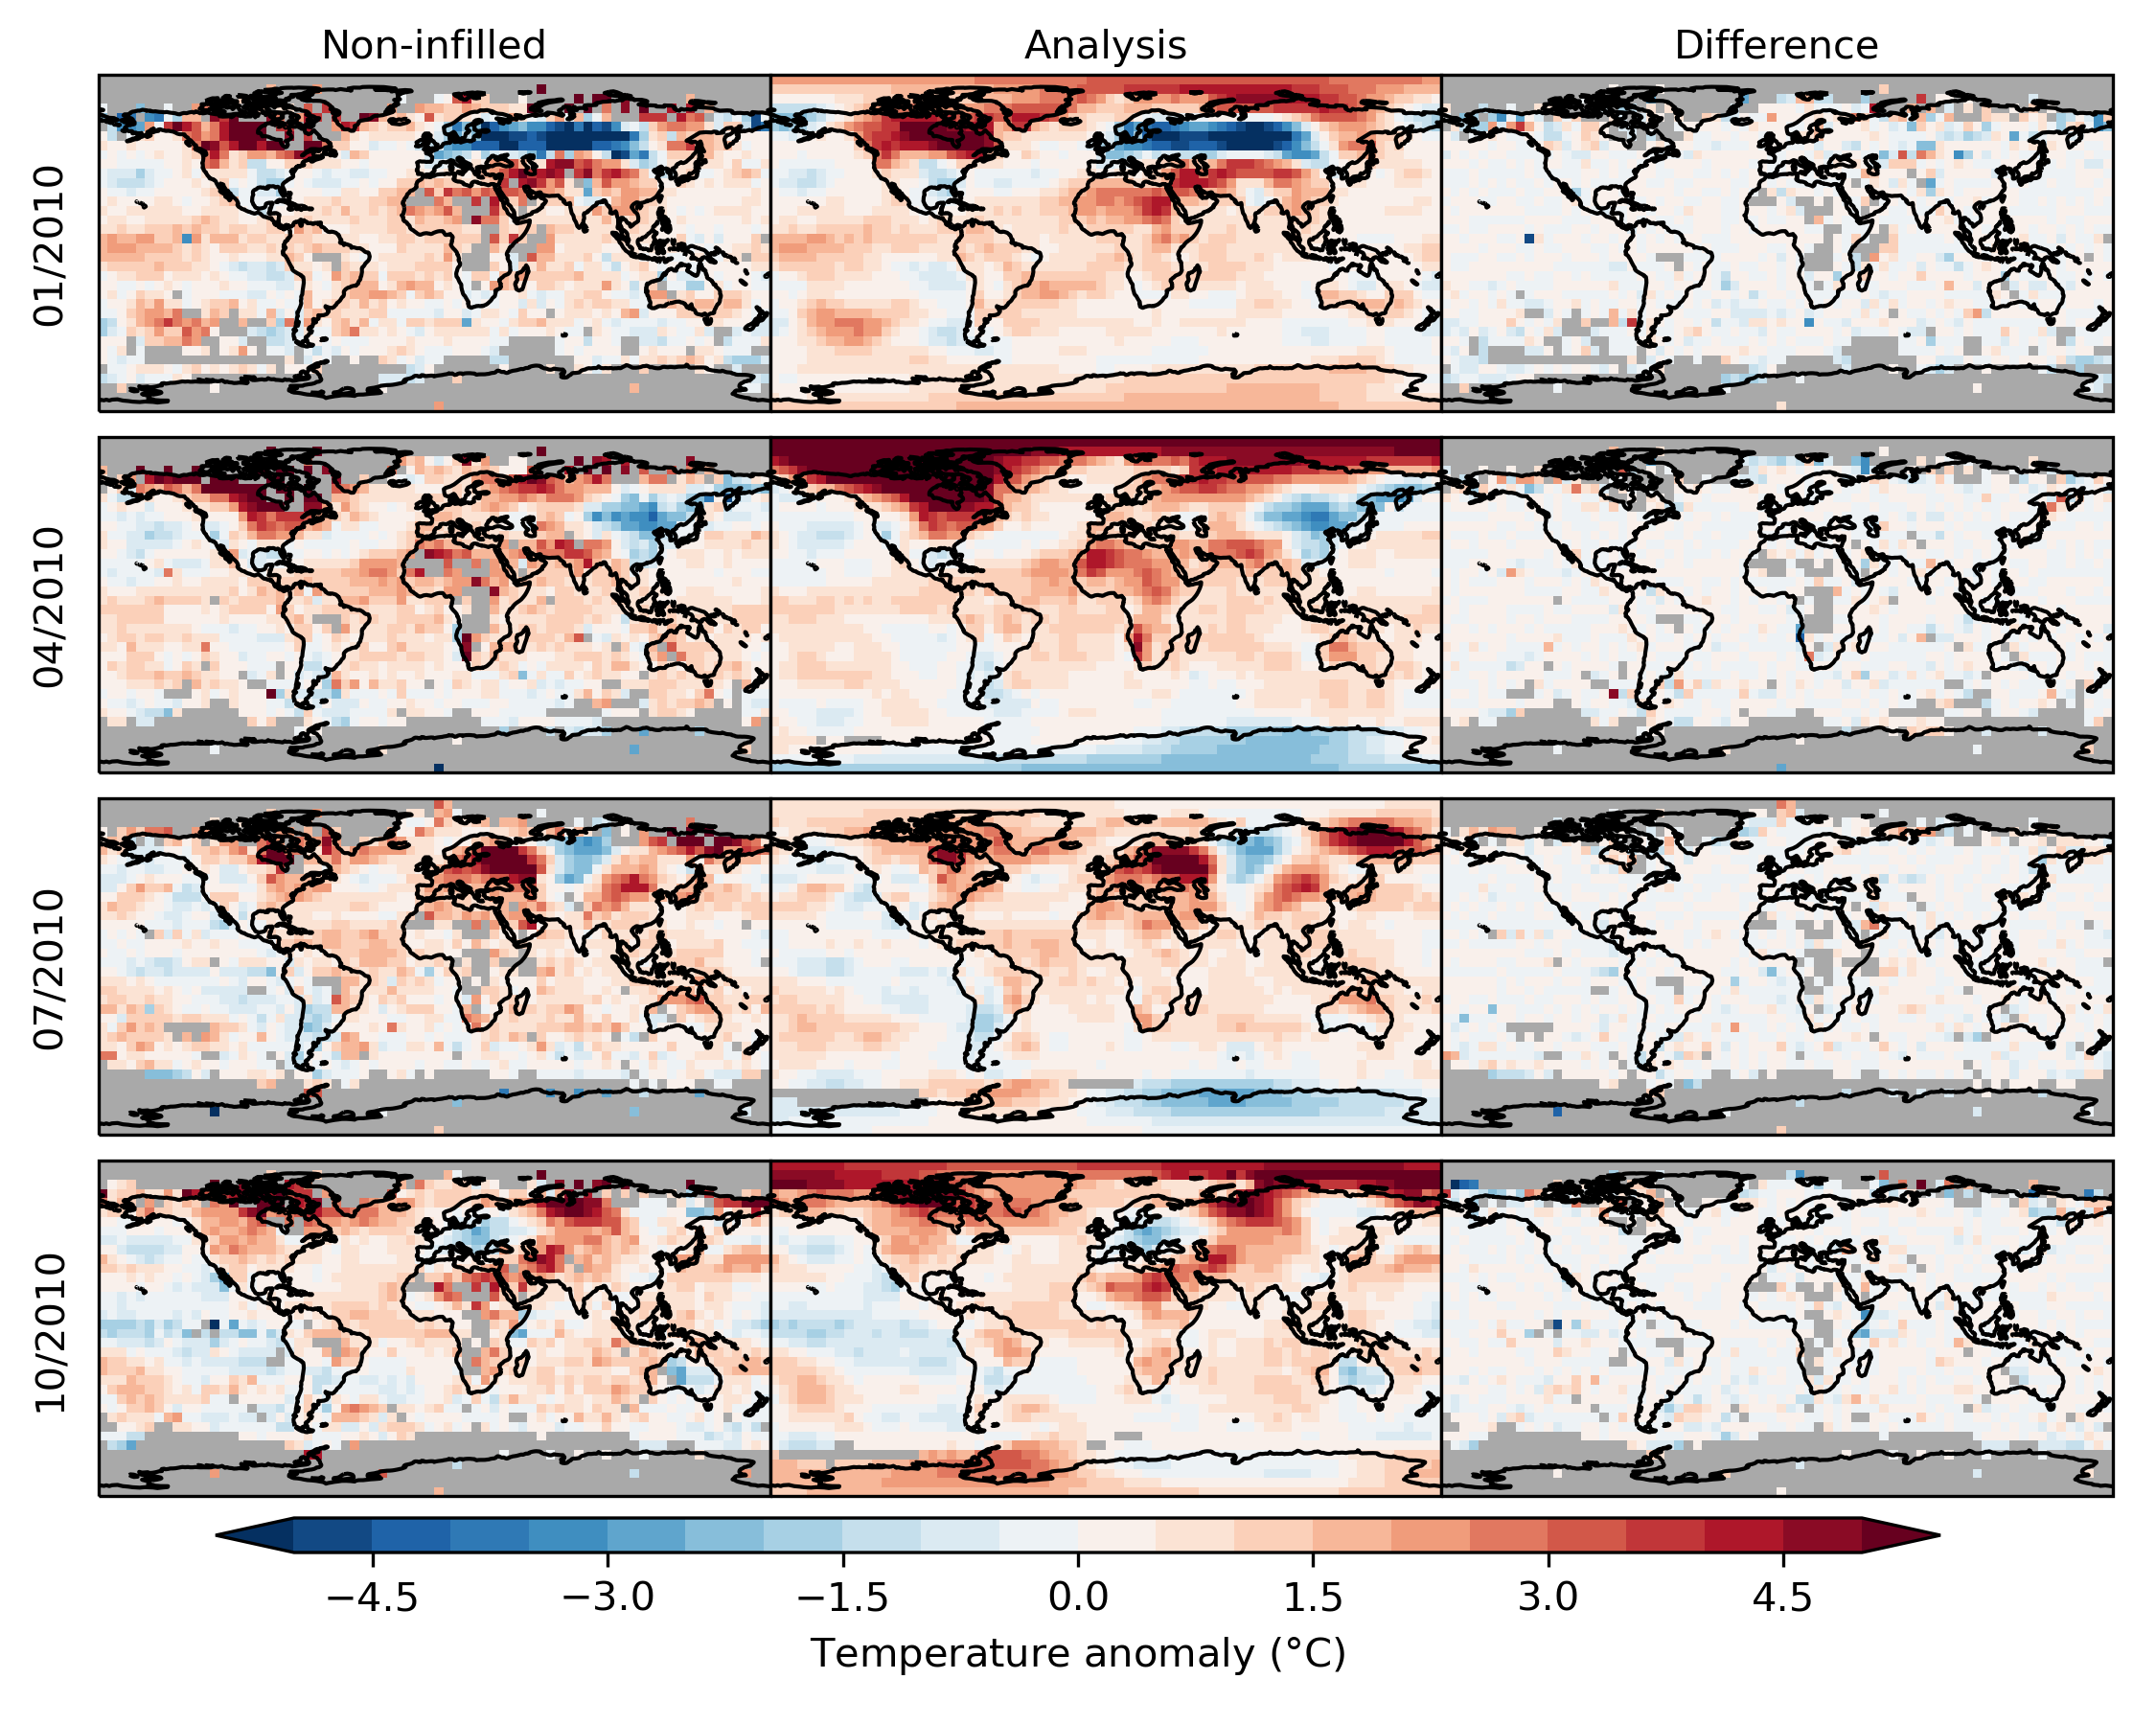
Caption: Maps showing near-surface temperature anomalies (temperature difference from the 1961-1990 average) for four months in 2010: January, April, July and October. The left column shows the non-infilled version of HadCRUT5 and the middle column shows the HadCRUT5 analysis. The right-hand column shows the difference between the two. Grey areas indicate grid cells for which temperatures have not been estimated due to lack of nearby data.
The statistical method extends coverage in data-sparse areas and gives an improved estimate in other areas where data are available but limited. It is based on the principle that areas that are close together have similar temperature anomalies and areas that are far apart do not. In areas with no measurements, we can get a reasonable, though not perfect, idea of what the temperature anomaly was based on nearby locations where we do have measurements.
Because temperatures over the land and ocean behave differently – they vary more over land than sea – we deal with the two surfaces separately. Areas of ocean covered by sea ice also behave differently to areas of open water so when we combine the land and ocean parts of the analysis, we use temperature anomalies from nearby land masses to estimate values over sea-ice-covered areas. The land, ocean and sea-ice areas combined give a more globally-complete picture of temperature change.
The increased data coverage has a few notable effects. Near-complete global coverage for the past sixty years or so means we now have an improved estimate of recent temperature changes. Global mean temperature changes faster in HadCRUT version 5 than in version 4 because we now make more balanced use of the sparse observations available in the rapidly-warming Arctic. The long-term change – from the start of the record in 1850 – is also slightly larger. Land areas have warmed more-rapidly than ocean areas and the improved coverage increases the relative contribution of land areas to the global average in the early record.
Although it’s important to understand how the improvements we have made affect global temperature, the updates should also benefit the many other users of the data set. For example, we now provide HadCRUT5 as an “ensemble” of 200 data sets which can be used to assess the combined effects of all the currently quantifiable uncertainties in the data. It combines uncertainties associated with:
- measurement errors,
- long-term correlated errors from changes in measurement method and instrument exposure,
- incomplete sampling, and
- the statistical analysis
in a consistent and easy-to-use way. The 200 ensemble members also respect the statistical properties of the temperature anomaly field, so each ensemble member should also be physically realistic (in so far as the statistical model is physically realistic). The improved coverage will be helpful to many users too. For others, a version of the data is provided without the statistical analysis, similar to HadCRUT4.
While we have improved the data set, it is by no means perfect. There are still major data gaps, particularly in the 19th Century. Systematic and regular monitoring of Antarctica did not start until the late 1950s, so there is a persistent data void at high southern latitudes before then. Digitization of paper records is needed to fill as many of the remaining blank spaces in the map as possible.
Uncertainties remain, particularly uncertainties associated with corrections for the effect of changing measurement methods that affect temperature records on the longest time scales. HadCRUT5 should be considered alongside other data sets, such as GISTEMP (produce by the NASA Goddard Institute for Space Studies), NOAAGlobalTemp, Berkeley Earth, Cowtan and Way, and dynamical reanalyses, to get a better understanding of near and long-term change and its uncertainties.
The natural question when a new data set appears, is what effect this has on our broader understanding of climate change and our chances of achieving the aim of the Paris Agreement “to strengthen the global response to the threat of climate change by keeping a global temperature rise this century well below 2 degrees Celsius above pre-industrial levels and to pursue efforts to limit the temperature increase even further to 1.5 degrees Celsius.” While it will take time for the new HadCRUT5 dataset to be taken up and used in climate studies that answer these questions directly, we can make certain observations.
First, an update to a single data set is unlikely to have a decisive effect on our estimates of climate sensitivity – a standardised measure reflecting the expected long-term warming caused by a doubling of CO2 in the atmosphere – and its uncertainty. The best current method draws on multiple lines of evidence and only one of these lines depends directly – and even then, not wholly – on the HadCRUT data set.
Second, there is no single agreed method for measuring progress towards the aims of the Paris Agreement. Authoritative reports such as the assessment reports of the Intergovernmental Panel on Climate Change and the WMO Statement on the State of the Climate, which estimate warming relative to pre-industrial conditions, use multiple global temperature data sets in the assessment. Changes to one of these data sets, therefore, will not necessarily translate into an equal change in the warming estimated once all the available evidence has been considered. Furthermore, there is significant uncertainty in the portion of the data set typically used as a stand-in for “pre-industrial” conditions: 1850 to 1900. Relative to a more modern baseline such 1981-2010 or 1986-2005, warming is now more consistent between data sets.
In summary, the HadCRUT5 data set uses new data and methods to get a more global view of historical temperature change. Globally, the new dataset shows more long-term warming than its predecessor, but this must be considered alongside other datasets of global temperature used in international assessments. HadCRUT5 is presented as an ensemble that, for the first time, gives users easy access to all currently quantifiable sources of uncertainty.