
North Atlantic tropical storm seasonal forecast 2009
Tropical storm seasonal forecast for the July to November period
Forecast for July to November 2009
Issued 18 June 2009
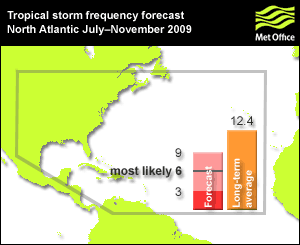
Six tropical storms are predicted as the most likely number to occur in the North Atlantic during the July to November period, with a 70% chance that the number will be in the range three to nine. This represents below-normal activity relative to the 1990-2005 long-term average of 12.4.
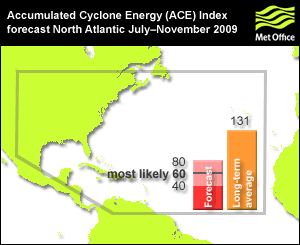
An ACE index of 60 is predicted as the most likely value, with a 70% chance that the index will be in the range 40 to 80 - which is below normal relative to the 1990-2005 average of 131.
Note: The forecast is for the five full months remaining in the June-November Atlantic tropical storm season.
More information?
A detailed report with information on probabilities and the strength and credibility of signals within the forecast is produced alongside the headline storm number prediction each season.
Download previous reports issued in June from 2007,2008 and 2009.
Background
'Tropical cyclone' is the generic term for a low-pressure system over tropical or subtropical waters, with intense convective activity (e.g. thunderstorms) and winds circulating in an anticlockwise direction in the northern hemisphere (clockwise in the southern hemisphere). A tropical storm is a tropical cyclone with mean wind speeds of at least 39 m.p.h. The terms hurricane and typhoon are region-specific names for strong tropical cyclones with wind speeds of more than 73 m.p.h.
The North Atlantic tropical storm season usually runs from June to November. The degree of activity over the whole season varies from year to year and is measured in several ways. The total number of tropical storms observed over the season is the best known measure of the level of storm activity. However, the total number of storms tells us little about variations in the intensity and lifetime of storms from one season to the next. The Accumulated Cyclone Energy (ACE) index is often used as an index of activity that includes storm lifetimes and intensities as well as total numbers over the season; it is a measure of the collective intensity and duration of all tropical storms over the season.
The year-to-year variability in the number of tropical storms forming over the North Atlantic is mainly influenced by variability in sea-surface temperatures (SST), over both the tropical North Atlantic, and the tropical Pacific. The table below shows numbers of storms and ACE index observed in recent years.
| 2004 | 2005 | 2006 | 2007 | 2008 | |
|---|---|---|---|---|---|
| Number of storms | 15 | 25 | 9 | 12 | 15 |
| ACE index | 225 | 239 | 76 | 71 | 144 |
Method
At the start of each North Atlantic season the Met Office forecasts the number of tropical storms expected throughout the period. This year, for the first time, we also include a forecast of ACE index. The forecast is made using a dynamical global seasonal prediction model (called Met Office seasonal prediction system: GloSea4 which simulates the ocean-atmosphere processes and interactions that determine tropical storm development. Multiple GloSea forecasts are made (using ensemble forecasting methods) to allow estimation of the range of likely outcomes. In contrast to the dynamical methods used in this forecast, statistical prediction methods, which have traditionally formed the basis of most published predictions, do not model atmospheric processes. They rely on past relationships between storm numbers and preceding observed conditions (e.g. preseason SST patterns).
Because the dynamical-model grid does not fully resolve relatively small features such as tropical storms, the model output is adjusted using storm counts from past forecasts and observations. A similar adjustment is made for the forecasts of ACE index. The GloSea forecast implicitly includes predictions of the sea-surface temperature (SST) anomalies. This season the GloSea SST predictions for the two influential regions, the tropical North Atlantic and the tropical east and central Pacific, both favour below-average North Atlantic tropical storm activity. Cooler-than-average SSTs are predicted for the tropical North Atlantic, while for the tropical east and central Pacific GloSea predicts that SSTs will continue to warm, and will remain substantially warmer than average through to November. The best estimate of six storms (range three to nine) predicted to occur this season represents well-below average activity and is below numbers observed in recent years; the last time a total of only six storms was observed was in 1992. The ACE index is also predicted to be below average.
Recent studies have shown that GloSea and other European dynamical models have considerable skill predicting the number of tropical storms - for example successfully predicting the change from the exceptionally active season of 2005 to the below-normal activity of the 2006 season. Last year the North Atlantic tropical storm seasonal forecast 2008 was for 15 storms with a 70% probability range of 10-20; in the event, 15 storms were observed to occur.
The forecast has been produced following research collaborations with the European Centre for Medium-Range Weather Forecasts (ECMWF).
Verification
The Met Office seasonal tropical storm forecast for the North Atlantic, issued on 18 June 2009, predicted below-normal activity for the July to November 2009 period, with a best estimate of six tropical storms (with a range 3-9) and an ACE index of 60 (range 40-80). The best estimate therefore predicted the quietest July to November period for more than a decade; the last season with six or fewer tropical storms was in 1992 (6) and the last season with an ACE index of 60 or less was in 1997 (38.8).
In the event the observed number of storms (9) and the observed ACE index (52.4) were both within the predicted ranges, and well below the 1990-2005 July to November averages of 12.4 and 131 respectively. Thus in terms of ACE index the season was indeed the quietest for over a decade. In terms of tropical storm numbers only 2006 has recorded nine or fewer tropical storms in the last decade (nine storms were recorded in the July to November period 2006).
Download a report on the forecast verification and analysis of the 2009 season. The Met Office will issue a public forecast for the June-November 2011 period in May 2011.
To view PDF documents you will need to download Adobe Reader