Mauna Loa carbon dioxide forecast for 2020
Forecast of the annual rise in atmospheric carbon dioxide concentration measured at the Mauna Loa, Hawaii for 2020
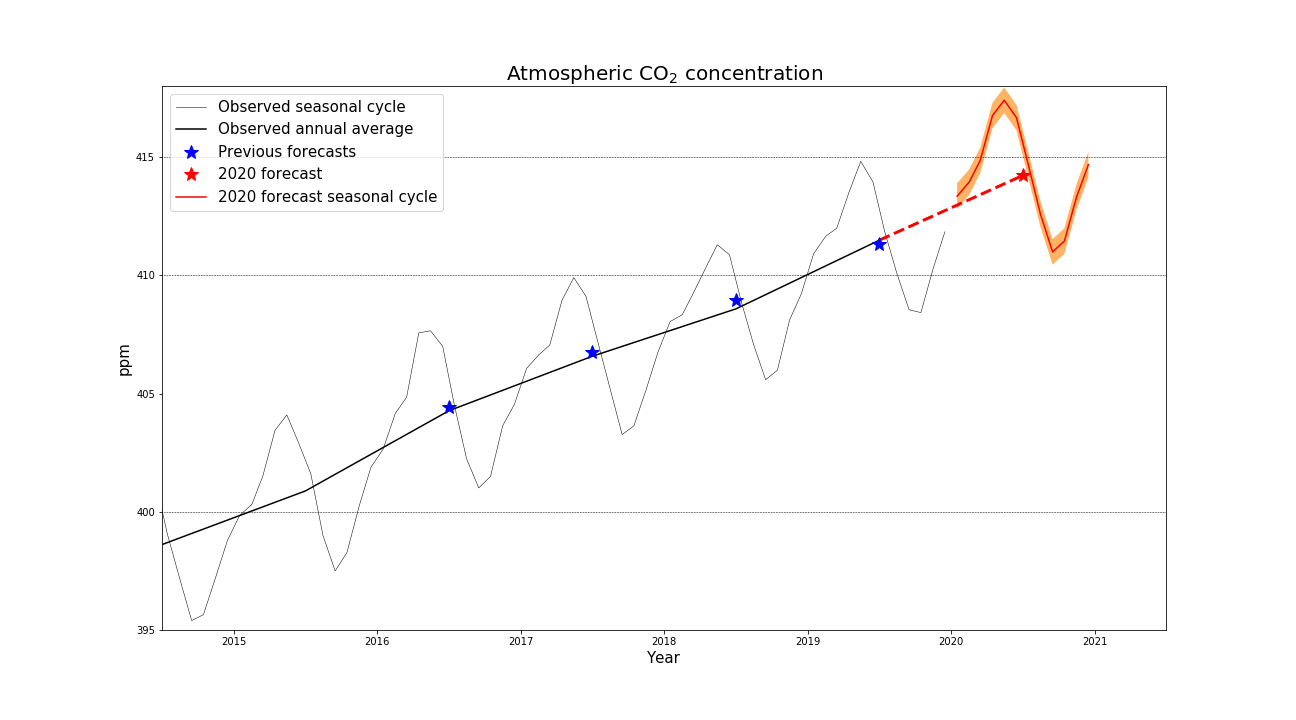
Figure 1. Forecast (red) CO2 concentrations at the Mauna Loa observatory, with previous forecasts (blue) compared to observations (black). The forecast uncertainty range (orange) based on the SST forecast is ± 2 standard deviations.
The size of the annual CO2 rise depends on anthropogenic emissions and the strength of natural carbon sinks which are affected by climate variability. Our method uses a statistical relationship between the annual CO2 rise, anthropogenic CO2 emissions and sea surface temperatures (SSTs) in the Niño3.4 region of the equatorial Pacific Ocean. We predict the rise between 2019 and 2020 will be similar to that between 2018 and 2019, which was larger than in the previous two years (Figure 2), because of relatively warm temperatures in the Niño3.4 region. Such "El Niño-like" conditions are generally associated with modified tropical weather patterns that make many land regions drier and reduce the ability of plants to grow and absorb CO2, temporarily reducing the removal of CO2 from the atmosphere. Along with other patterns of atmospheric variability, this has played a role in the recent hot and dry conditions in Australia, which contributed to the severity of the bushfires. The high temperatures were also made even more extreme by the ongoing warming due to anthropogenic climate change.
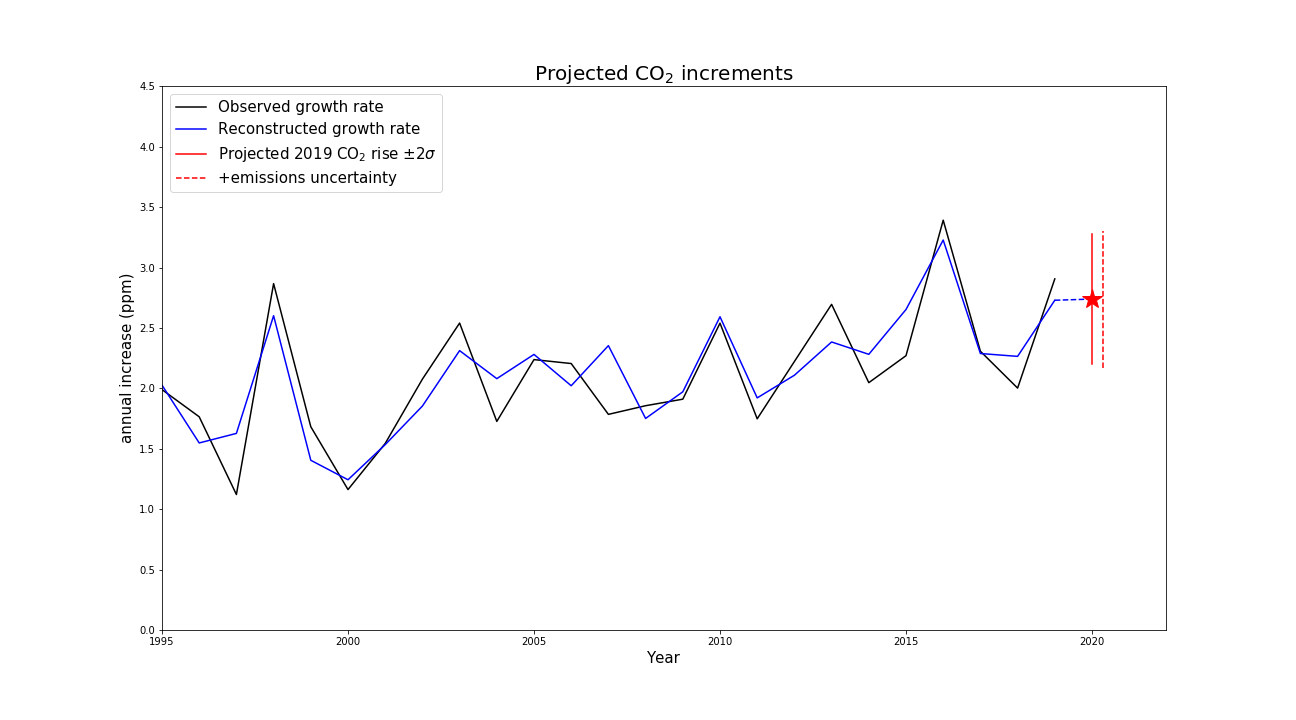
Figure 2. Annual increments (growth rate) in CO2 concentration at the Mauna Loa observatory from observations (black), our statistical reconstructions and past forecasts (blue) and 2020 forecast (red). The forecast uncertainty range based on the SST forecast (solid red line) is ± 2 standard deviations. Uncertainty in the 2019 emissions increases the total uncertainty slightly (dashed red line).
Estimates from the Global Carbon Budget suggest that total emissions from fossil fuel burning and land use change increased from 11.49 GtC in 2018 to 11.56 GtC in 2019, so this will also have made a small contribution to a faster rise in CO2 concentrations.
The CO2 concentration at Mauna Loa also varies during the year due to uptake of CO2 by ecosystems in the northern hemisphere spring and summer growing season and a release of CO2 as vegetation dies back in autumn and winter. In 2020, assuming the usual atmospheric and land ecosystem response to the mild warming in the Pacific, we forecast this seasonal cycle is to peak at 417.4 ± 0.6 ppm in May and return to a minimum of 411.0 ± 0.6 ppm in September before rising again. (Figure 1, Table 1).
Table 1. Forecast monthly average CO2 concentrations at Mauna Loa over 2020
| Month | Forecast CO2 concentration (ppm) |
|---|---|
| January | 413.4 |
| February | 414.0 |
| March | 414.9 |
| April | 416.8 |
| May | 417.4 |
| June | 416.7 |
| July | 414.7 |
| August | 412.6 |
| September | 411.0 |
| October | 411.5 |
| November | 413.3 |
| December | 414.7 |
Contributions of anthropogenic emissions and varying natural carbon sinks to the CO2 rise
Long-term increases in observed CO2 are entirely the result of human-caused emissions of carbon dioxide into the atmosphere – more than enough CO2 has been emitted by fossil fuel burning, cement production and deforestation to account for the increase measured in the atmosphere. CO2 concentrations have increased by about 30% since measurements began at Mauna Loa, but this increase would have been larger if some CO2 had not been removed from the atmosphere by absorbed by plants and the oceans.
These natural sinks vary in strength from year to year as a result of short-term fluctuations in climate, principally through El Niño-La Niña cycles in the Tropical Pacific Ocean. As a result, the Met Office CO2 forecast takes account of both anthropogenic emissions and the impacts of climate variability on natural carbon sinks. Our forecast for the 2019-2020 CO2 rise uses the annual total CO2 emissions from 2019 and sea surface temperatures observed from April to October 2019 and forecast from November 2019 to March 2020.
We can estimate the potential contribution of El Niño-like conditions to the forecast CO2 rise by repeating our forecast calculation without the sea surface temperature change, ie: with "neutral" conditions. This suggests that without an El Niño-like response in the atmosphere and tropical land ecosystems, the annual mean CO2 rise would be 2.48 ppm (Table 2).
We can also estimate the contribution of the higher emissions in 2019 compared to 2018, and compared to the average of the previous decade. If 2019 emissions had been the same as 2018, forecast CO2 rise for 2019-2020 would be 0.01 ppm smaller (Table 2). If 2019 emissions had been the same as the average for 2009-2018, the forecast CO2 rise for 2019-2020 would be 0.12 ppm smaller. From this it is clear that the year-to-year variability in the rate of rise of CO2 in the atmosphere is affected more by the strength of carbon sinks than year-to-year changes in anthropogenic emissions. Nevertheless, the anthropogenic emissions are still the overall driver of the long-term rise in concentrations.
Table 2. CO2 rise (ppm) for 2019-2020 calculated with different combinations of El Niño-like sea surface temperature (SST) and emissions influences
|
El Niño-like SSTs |
Neutral SSTs |
|
|---|---|---|
|
2019 emissions |
2.74 |
2.48 |
|
2018 emissions |
2.73 |
|
|
Average 2009-2018 emissions |
2.62 |
Contribution of emissions from the 2019/20 Australian bushfires
Preliminary data from the Global Fire Emissions Database* suggest that between 0.1 and 0.2 Gt C were emitted by the recent Australian bushfires. Using this in our forecast method, we calculate that would contribute approximately 0.02 and 0.05 ppm to the CO2 rise.
To put this in context with the year-by-year change in global anthropogenic emissions, these initial estimates suggest that the bushfires contributed more to the annual CO2 rise than the increase in anthropogenic emissions between 2018 and 2019.
The contribution of carbon release from the bushfires would be partly accounted for in our forecast, since our method is based on a statistical relationship between annual CO2 rise and SSTs in the equatorial Pacific, and the Pacific SSTs are considered to have played a role in causing the hot, dry conditions in Australia. However, other factors including Indian Ocean SSTs and sudden stratospheric warming also made substantial contributions, and these would not be captured by our statistical method. Because of the partial contribution of ENSO SSTs, we do not include the bushfire emissions as an additional factor in our CO2 forecast. In principle, the non-ENSO contribution to the bushfires could be considered as an additional factor. In our current method, the impact of this included within the error bars. Quantifying the relative contributions of ENSO, other modes of climate variability and anthropogenic climate change to the bushfires and the resulting emissions requires further investigation.
A further point is that if the Australian ecosystems fully regrow and achieve their pre-bushfire biomass, the emissions from the fires could be considered a temporary addition to the atmosphere. Nevertheless, it is possible that the widespread impact of the fires and potentially an altered wildfire regime might result in a new ecosystem state with a lower biomass. All these are important avenues for future research.
Comparison with previous annual CO2 rises
The forecast CO2 rise of 2.74 ± 0.57 ppm for 2020 would be the fourth largest annual increment on record (Figure 3). The annual increments have generally been increasing over time as a result of rising anthropogenic emissions. The largest on record was 2016, due to a major contribution from the 2015/16 El Niño event. The second largest was in 2019, slightly larger than 1998, despite a major El Niño in 1997/98 and only minor El Niño-like conditions in 2018/19. The increase in anthropogenic emissions between 1998 and 2019 meant that a smaller ENSO contribution was able to bring the annual CO2 rise to the level of a previous large increase.
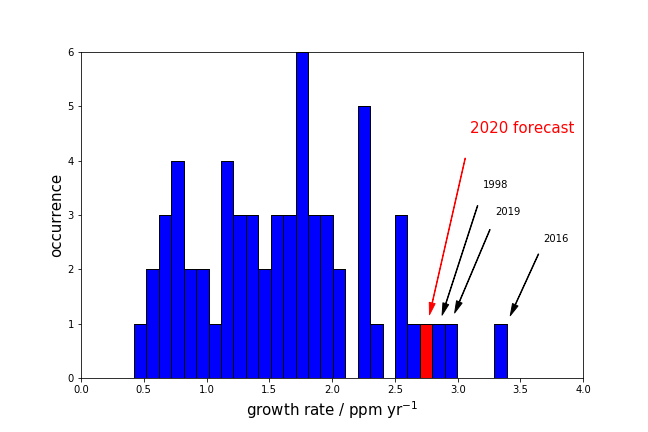
Figure 3. Frequency distribution of annual CO2 rise (growth rate) for each year in the Mauna Loa record.
Verification of previous CO2 forecasts
The technique used to make this forecast was also used to make forecasts ahead of time for 2016, 2017, 2018 and 2019. The methodology combines ocean observations and seasonal forecasts with a statistical prediction of their impact on carbon sinks. When applied to latest estimates of fossil fuel burning, it gives us a predicted growth rate for the coming year. Figure 4 and Tables 3 and 4 provide a summary verification of our previous forecasts. The CO2 rise from 2015 to 2016 was successfully forecast to be the largest on record (Table 3), due to the amplifying effects of the large 2015/16 El Niño event, and the rises in 2016/17 and 2017/18 were also successfully forecast to be more moderate. The 2018/19 CO2 rise was succesfully forecast to be larger than 2016/17 and 2017/18 but not as large as 2015/16.
Table 3. Summary of forecast and observed CO2 concentrations and rises for 2016, 2017, 2018, 2019 and the forecast for 2020. Where observations were within the error estimates of the forecast, this is underlined. Where observations are outside the error estimates, this is shown in italics.
|
Annual mean CO2 concentration (ppm) |
Increase from previous year (ppm) |
May concentration (ppm) |
September concentration (ppm) |
|||||
|---|---|---|---|---|---|---|---|---|
|
Year |
forecast |
observed |
forecast |
observed |
forecast |
observed |
forecast |
observed |
|
2020 |
414.2 ± 0.6 |
|
2.74±0.57 |
|
417.4±0.6 |
|
411.0±0.6 |
|
|
2019 |
411.3±0.58 |
411.49 |
2.74±0.58 |
2.90 |
414.7±0.58 |
414.83 |
408.1±0.58 |
408.55 |
|
2018 |
408.94±0.59 |
408.59 |
2.29±0.59 |
2.00 |
412.20±0.59 |
411.31 |
405.79±0.59 |
405.59 |
|
2017 |
406.75±0.61 |
406.59 |
2.46±0.61 |
2.31 |
409.86±0.61 |
409.91 |
403.72±0.61 |
403.27 |
|
2016 |
404.45±0.53 |
404.28 |
3.15±0.53 |
3.39 |
407.57±0.53 |
407.65 |
401.48±0.53 |
401.01 |
The observed annual mean rise in 2019 was 0.16 ppm larger than the central estimate of the forecast, within the uncertainty of 0.58 ppm (Table 3). The monthly concentrations were all within the forecast uncertainty, but were slightly above the central estimates of the forecast in January, February and September (Figure 4, Table 4).
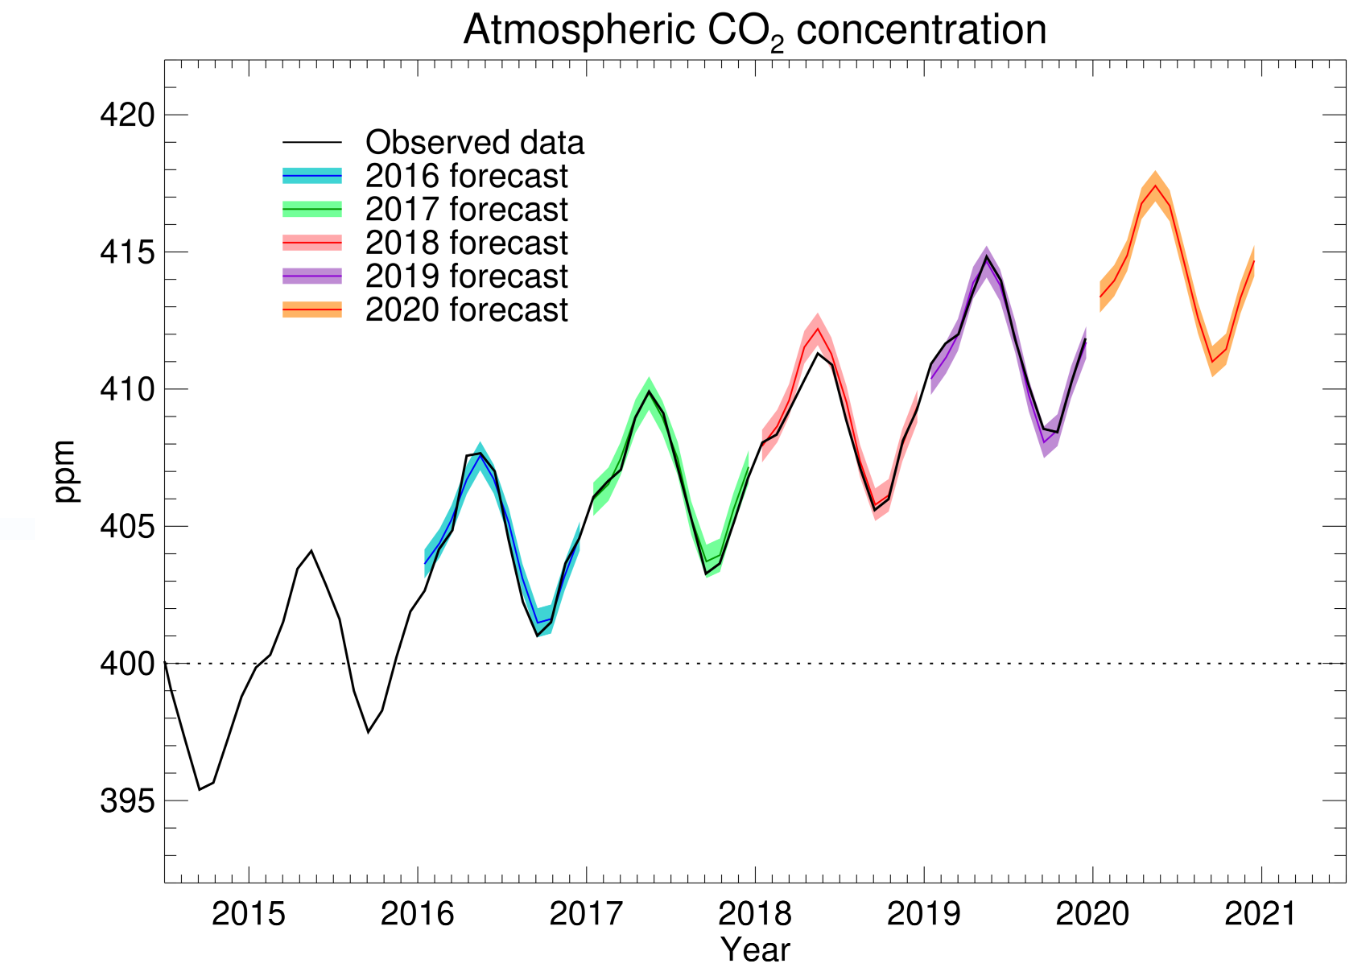 Figure 4. Forecast CO2 concentrations at Mauna Loa over 2020 (orange), along with previous forecast concentrations for 2016 (blue), 2017 (green), 2018 (red) and 2019 (purple) and Scripps Institute measurements (black).
Table 4. Forecast and observed monthly average CO2 concentrations at Mauna Loa over 2019. The uncertainty in the forecast values was ±0.6 ppm
|
Month |
Forecast CO2 concentration (ppm) |
Observed CO2 concentration (ppm) |
|---|---|---|
|
January |
410.4 |
410.9 |
|
February |
411.2 |
411.7 |
|
March |
412.0 |
412.0 |
|
April |
413.9 |
413.5 |
|
May |
414.7 |
414.8 |
|
June |
413.8 |
414.0 |
|
July |
411.9 |
411.9 |
|
August |
409.8 |
410.1 |
|
September |
408.1 |
408.6 |
|
October |
408.5 |
408.4 |
|
November |
410.2 |
410.3 |
|
December |
411.7 |
411.9 |
Including the effect of ENSO variability improves the skill of the CO2 rise forecast beyond that which would be achieved by considering anthropogenic emissions alone (Figure 5). In 2016, consideration of the large El Niño event allowed the record rise in atmospheric CO2 to be successfully forecast. The 2016 rise would have been underestimated without this. In 2018, the CO2 rise would have been overestimated if the effects of the La Niña conditions had been neglected.
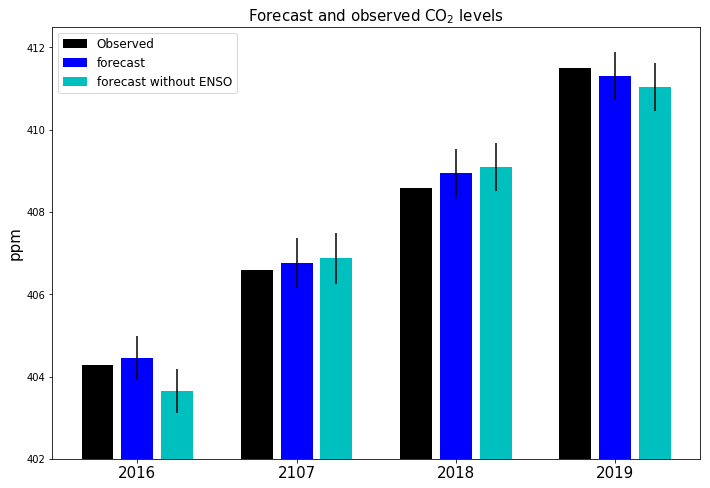
Figure 5. Observed (black) and forecast (dark blue) annual average CO2 concentrations for 2016, 2017, 2018 and 2019, and re-forecast values based on emissions alone, without the effects of ENSO (light blue). Thin black lines show the forecast error bars.
Definitions of annual CO2 rise and growth rate
We define the annual CO2 rise for a particular year as the difference in annual average concentration for that calendar year and that of the previous calendar year. This is different to the definition of annual 'growth rate' as published by NOAA which is the average change across an individual calendar year.
*Emissions from Australian bushfires
GFED presents annual total emissions for all of Australia. Preliminary estimates of the emissions from the recent bushfires in New South Wales and Victoria were kindly provided by the GFED t