
Cold snap marks the end of a mild, wet Autumn
Author: Press Office
14:00 (UTC) on Fri 1 Dec 2023
Despite cold weather closing out autumn, it has been a mild season overall, especially across the southern half of the UK.
South-west England has provisionally recorded it’s warmest autumn on record in a series from 1884, and Wales has also recorded its equal-warmest autumn.
The UK recorded a seasonal mean temperature of 10.76°C, 1.04°C above the 1991-2020 long term average, with anomalies of +1.53°C for south-west England and +1.41°C for Wales.
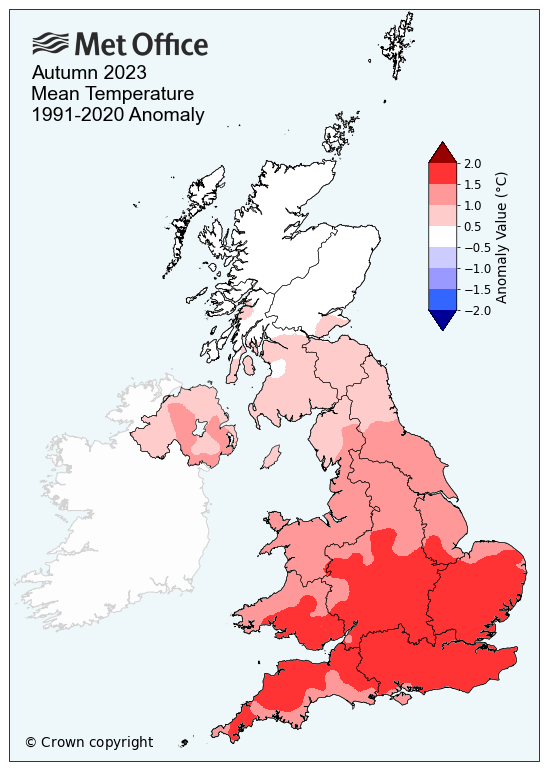
This UK seasonal mean temperature makes it the 6th warmest autumn in the series from 1884. The last three autumns (2021 to 2023) have all been very mild, with anomalies of +1.1°C, +1.3°C and +1.0°C respectively. For the climate district of south-west England and south Wales this was the warmest autumn on record, marginally warmer than 2011 and 2006.
Autumn rainfall
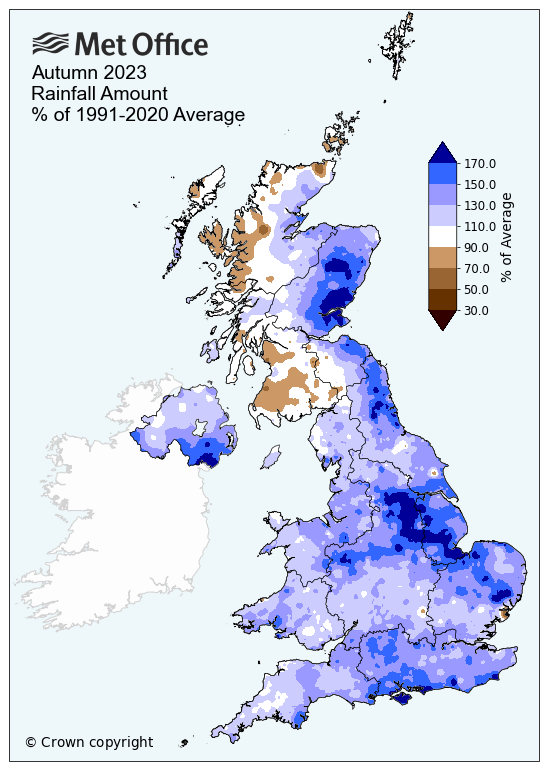
It has been a wet autumn across the UK, except for western Scotland, with parts of eastern Scotland, north-east and eastern England, southern England and the east of Northern Ireland receiving over 150% of the 1991-2020 long term average. Areas such as Angus, South Yorkshire, Nottinghamshire, the Isle of Wight and County Down have been particularly wet.
The UK recorded a seasonal rainfall total of 409.8mm, 122% of the 1991-2020 long term average. Northern Ireland (132%) had its 8th wettest autumn, Eastern Scotland (135%) its 7th wettest autumn, northern England (135%) its 9th wettest autumn and south-east England its 9th wettest autumn in series from 1836.
The three months of the autumn have seen dramatic contrasts in the weather. Settled weather in early September brought many warm, dry, sunny days with a very notable heatwave. 30°C was reached on seven consecutive days (a September record), including, unusually, the UK’s highest temperature of the year: 33.5°C at Faversham, Kent on 10th. It was the UK’s equal-warmest September on record (with 2006).
Mix of Autumnal weather
Early October saw some fine weather in the south with temperatures reaching 25°C in the south-east – the most significant October warm spell since 2011. However, overall this was an unsettled and very wet month. The UK recorded its 6th wettest October in the series from 1836 and Eastern Scotland recorded its wettest October by a wide margin. Much of eastern Scotland, eastern England, south-east England and the east of Northern Ireland received well over twice the monthly average rainfall.
Four named storms affected the UK during the autumn from late September to mid-November: Agnes, Babet, Ciarán and Debi. These contributed to exceptionally wet and, at times, stormy weather. From 6th to 7th, October, Scotland had its wettest 2-day period on record, while Babet from 18th to 20th brought the third wettest 3-day period on record for England and Wales. Storm Ciarán, at the start of November, was an exceptionally powerful storm – comparable in severity with the ‘Great Storm’ of 16 October 1987 – but with the strongest winds further south across the Channel Islands and Northern France.
Met Office senior scientist Mike Kendon said: “Once again, the autumn has demonstrated the huge variability in our climate. Temperatures over 30°C in early September seem a distant memory to the current cold snap, with a hard frost and snow currently lying on Dartmoor.
"The succession of named storms experienced through the autumn illustrates the potential of our weather, strong winds and particularly heavy rain, to cause significant widespread impacts. Overall this has been another mild and wet autumn, and this is consistent with the ongoing pattern which is emerging as our climate continues to change.”
Provisional Autumn 2023 statistics
| Maximum temp | Minimum temp | Mean temp | Rainfall | Sunshine | ||||||
|---|---|---|---|---|---|---|---|---|---|---|
| Area | Actual temp (°C) | Anomaly (°c) | Actual temp (°C) | Anomaly (°C) | Actual temp (°C) | Anomaly (°C) | Actual (mm) | Anomaly (%) | Actual (hours) | Anomaly (%) |
| UK | 14.22 | 1.11 | 7.30 | 0.96 | 10.76 | 1.04 | 409.8 | 122 | 291.8 | 105 |
| England | 15.69 | 1.53 | 8.31 | 1.35 | 12.01 | 1.45 | 339.7 | 135 | 326.9 | 106 |
| Wales | 14.64 | 1.28 | 8.36 | 1.56 | 11.47 | 1.41 | 538.7 | 125 | 261.4 | 95 |
| Scotland | 11.73 | 0.39 | 5.31 | 0.14 | 8.50 | 0.28 | 489.1 | 107 | 245.3 | 107 |
|
N. Ireland |
13.93 | 0.98 | 7.35 | 1.02 | 10.60 | 0.97 | 428.9 | 132 | 267.5 | 106 |
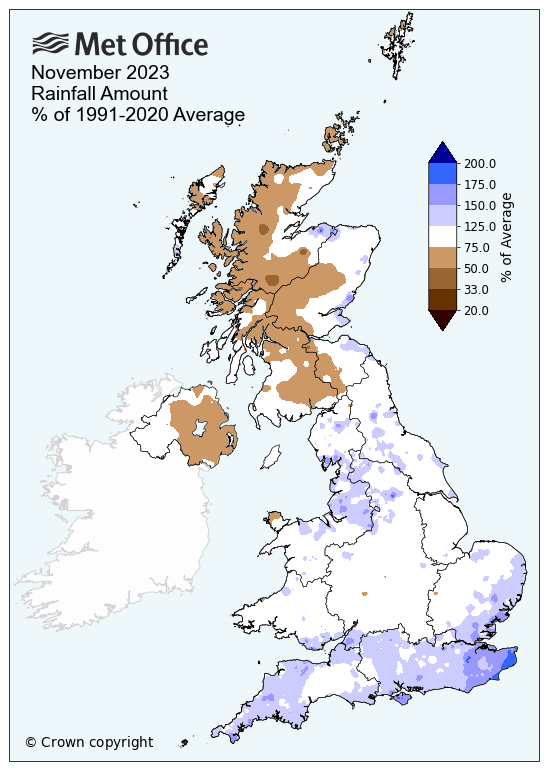
November overview
The statistics for November are fairly unremarkable, with temperatures and sunshine amounts close to average. Despite a very wet first half of the month, including Storm Ciarán and Storm Debi, rainfall totals have also been near average in many areas, with drier weather later in the month providing respite from the prolonged wet weather through much of the autumn.
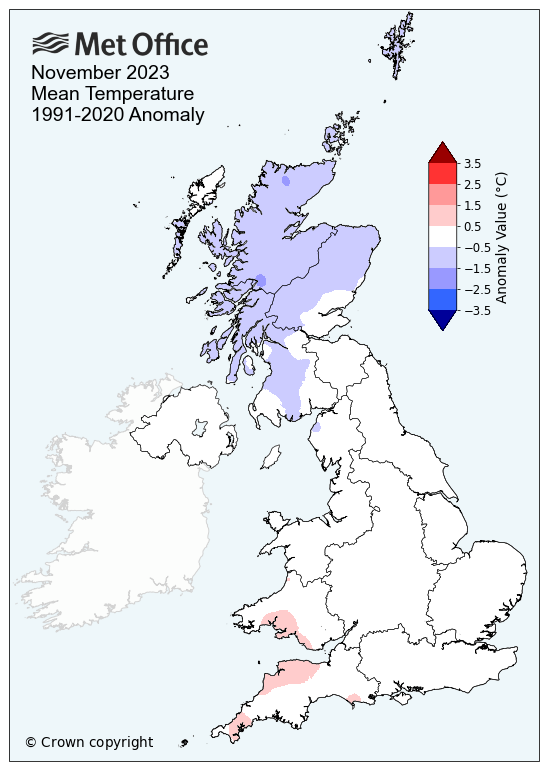
While temperatures for November have been fairly near average overall, there have been incursions of colder air. They first dropped mid-month with -7.1°C recorded at Altnaharra, Sutherland on 16th, and frosts as far south as Kent with -0.8°C at East Malling, Kent on 12th, though nothing extreme for the time of year. The last week has also seen a return of colder wintry weather to the UK, with hard frosts and wintry precipitation in the north and east.
Provisional November 2023 statistics
| Maximum temp | Minimum temp | Mean temp | Rainfall | Sunshine | ||||||
|---|---|---|---|---|---|---|---|---|---|---|
| Area | Actual temp (°C) | Anomaly (°c) | Actual temp (°C) | Anomaly (°C) | Actual temp (°C) | Anomaly (°C) | Actual (mm) | Anomaly (%) | Actual (hours) | Anomaly (%) |
| UK | 9.3 | -0.1 | 3.4 | -0.2 | 6.3 | -0.1 | 118.9 | 96 | 64.6 | 112 |
| England | 10.3 | 0.1 | 4.3 | 0.2 | 7.3 | 0.2 | 110.8 | 120 | 75.4 | 116 |
| Wales | 9.9 | 0.1 | 4.8 | 0.6 | 7.3 | 0.3 | 174.6 | 108 | 49.4 | 89 |
| Scotland | 7.5 | -0.5 | 1.4 | -1.1 | 4.4 | -0.8 | 122.4 | 74 | 51.1 | 107 |
|
N. Ireland |
9.9 | 0.2 | 3.7 | 0.0 | 6.8 | 0.1 | 92.0 | 75 | 61.5 | 113 |